🌍 Public
ICE5
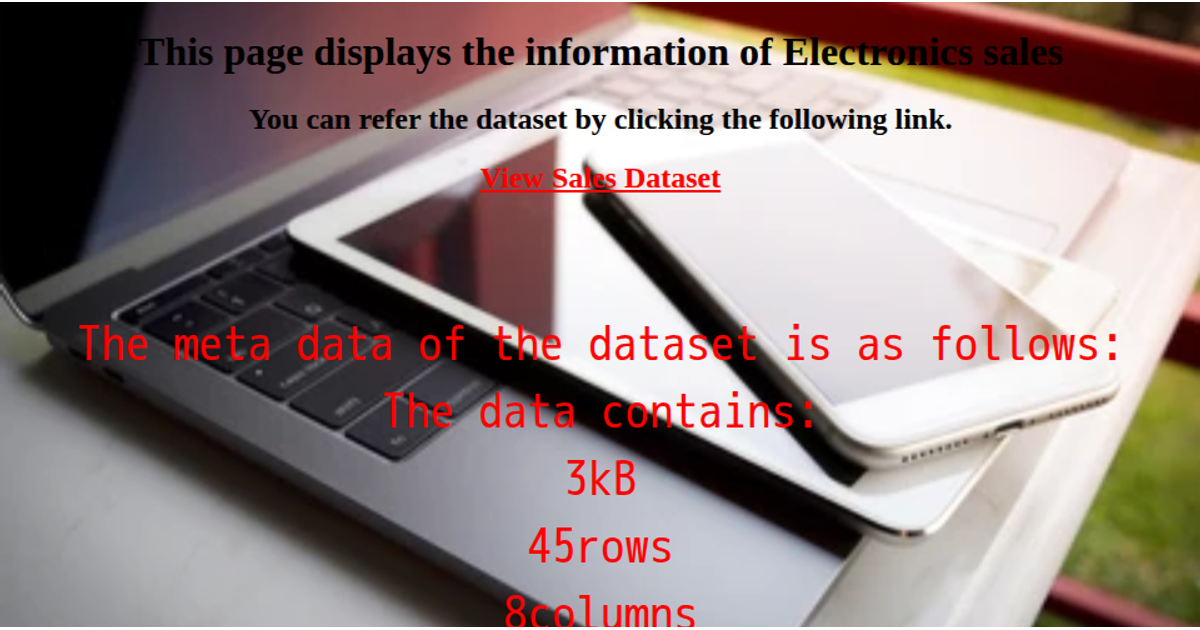
This page presents a summary of stolen property data, displaying metadata about the dataset. It uses D3.js (version 7) to load the CSV from a URL and calculate its size, row count, and column count, presenting these metrics as text. The page uses a custom CSS background image of a stolen property icon. The visualization provides a direct link to view the underlying property stolen and recovered dataset. The design uses basic text output, not a chart, to convey the data's dimensions.
AI-generated descriptionA bare minimum HTML page demonstrating use of CSS and JavaScript.
See also React Starter.
MIT Licensed




Comments
Sign in to join the discussion.