🌍 Public
Demo
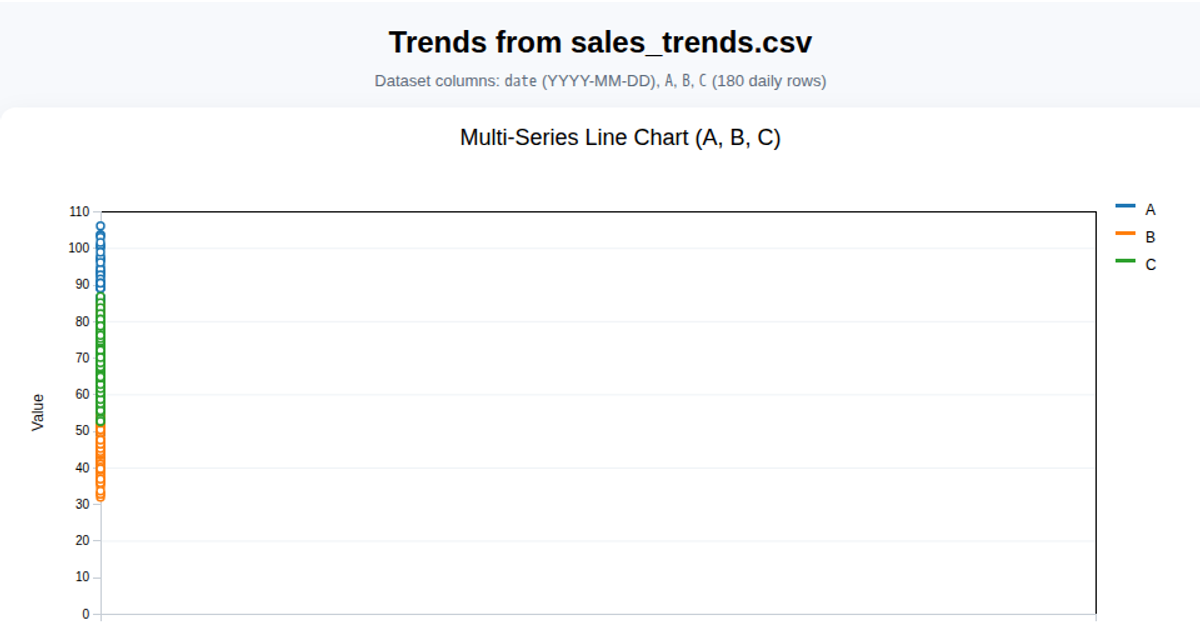
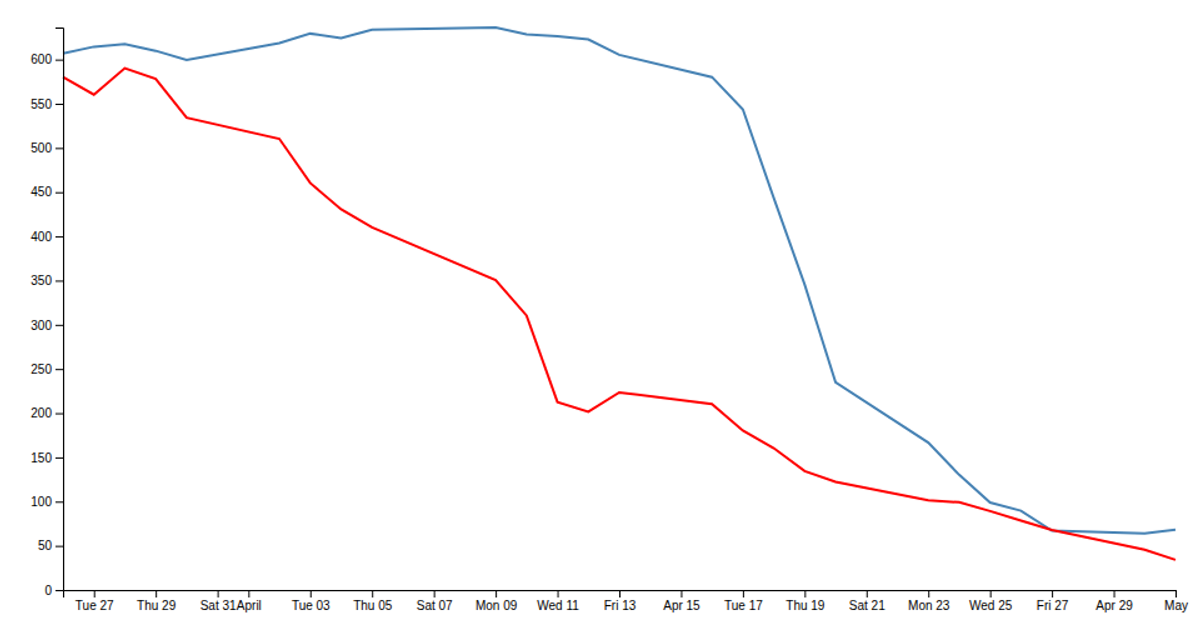
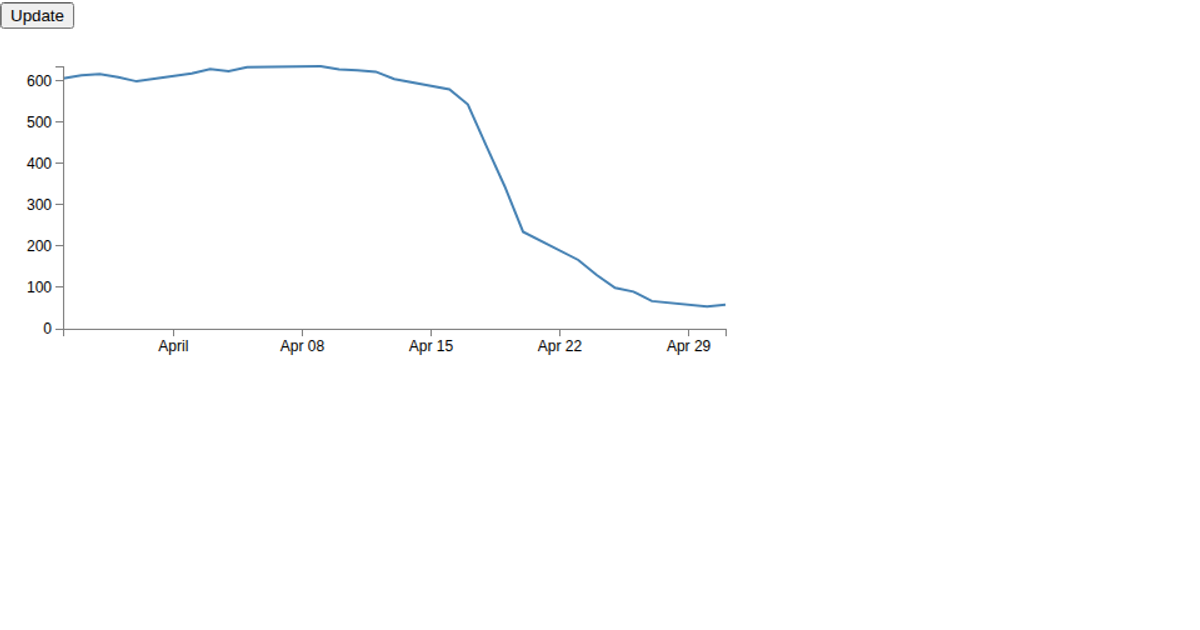
Two line charts display daily price data for assets A and B across separate tabbed panels. Each chart uses D3's time scale for dates, linear scale for values, and an SVG path generated with `d3.svg.line`. The data loads from tab-separated files, parsed with `d3.time.format` and accessed via `d3.tsv`. Bootstrap tabs toggle between charts, with each panel's script re-rendering its respective visualization.
AI-generated descriptionMIT Licensed





Comments
Sign in to join the discussion.