Maharashtra districts SC population
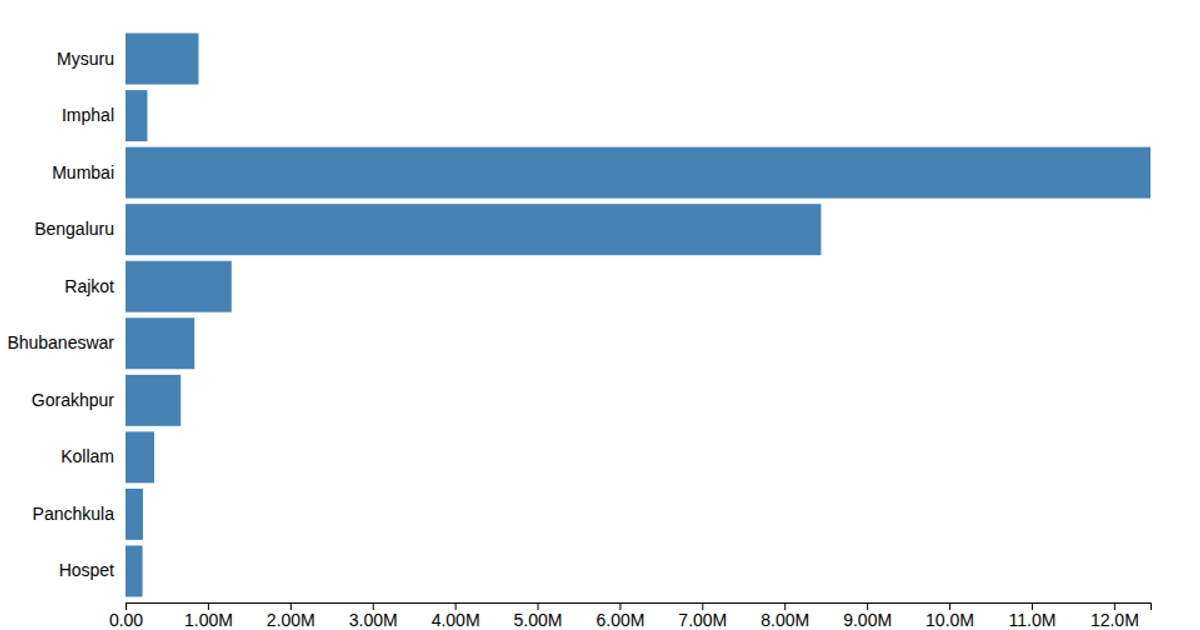
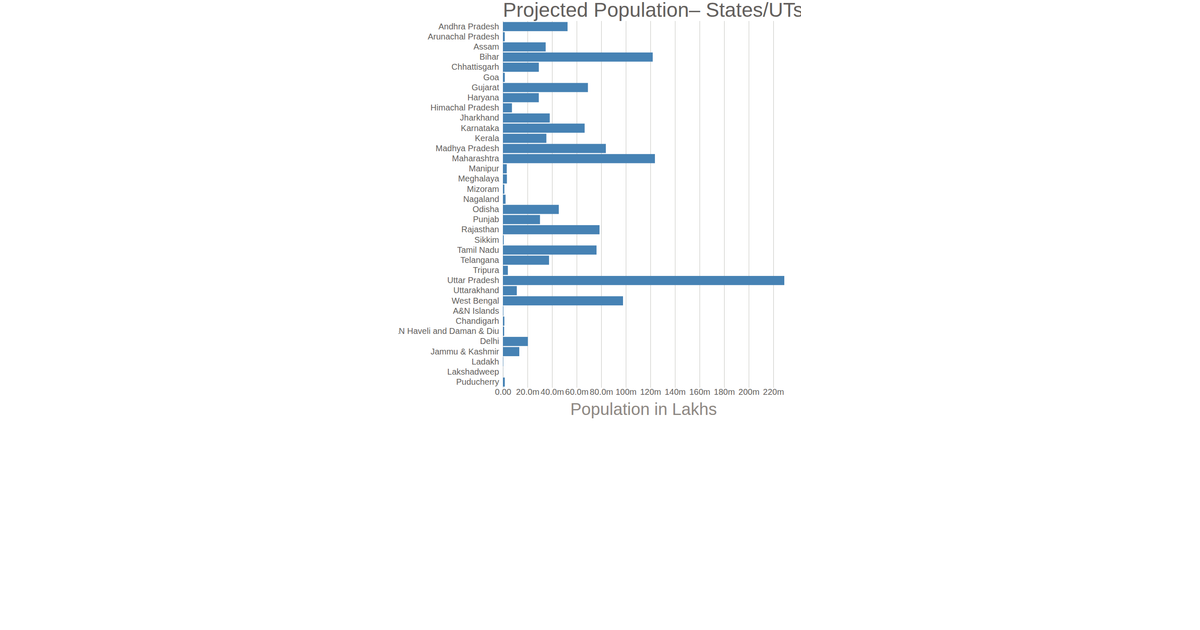
This bar chart displays the Scheduled Caste (SC) population across districts of Maharashtra State for the year 2011, with districts sorted in descending order of total population. The visualization uses D3 v5 with SVG rendering and animated bar growth via transition delays. It employs scaleBand for the categorical y-axis and scaleLinear for the x-axis, with custom tick formatting. Data is loaded from a CSV file sourced from the Maharashtra State Database (mahasdb). District names appear on the left axis, while the x-axis labels are formatted in abbreviated notation and styled with semi-transparent magenta bars.
AI-generated descriptionThis bar chart shows districtwise SC And ST Population For The Year 2011(Maharashtra State). The data comes from Districtwise SC And ST Population For The Year 1991,2001 And 2011.






Comments
Sign in to join the discussion.