🌍 Public
CO2 emissions vs Year Project prototype v1
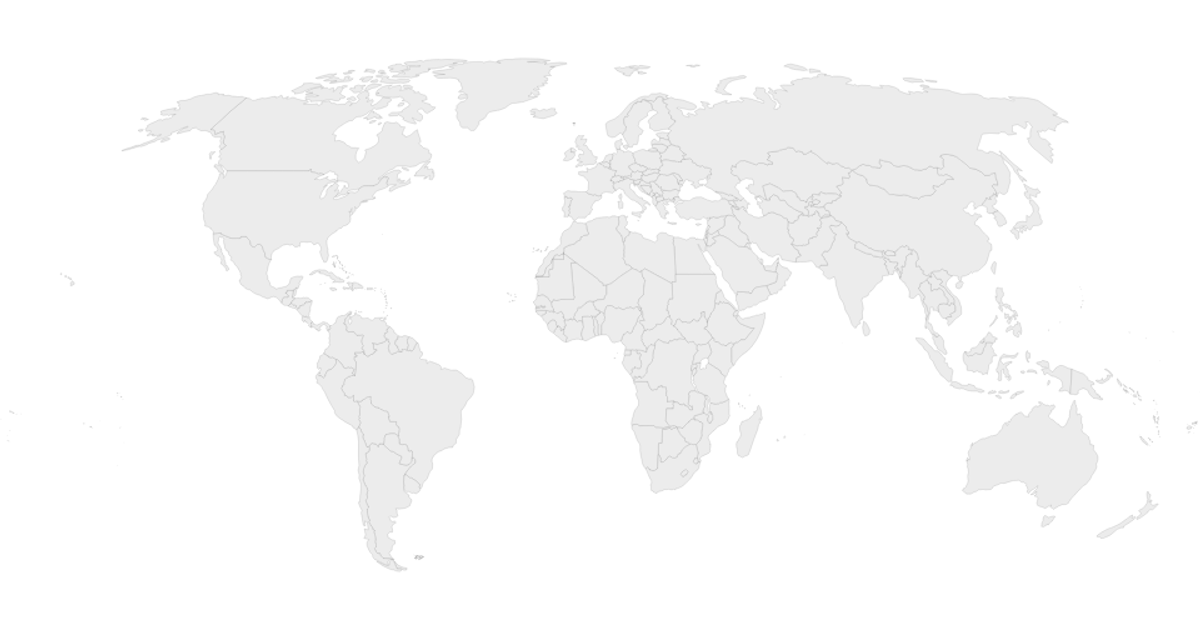
This prototype visualizes global CO₂ emissions changes over time using a choropleth world map. It loads yearly emission values per country from a CSV and maps them to a white-to-green color scale applied to SVG country paths. The React app manages the map state, while D3 v7 utilities handle CSV loading, color scaling, and the rendering logic via the `d3` library’s `select`, `scaleLinear`, and `csv` modules.
AI-generated descriptionMIT Licensed




Comments
Sign in to join the discussion.