🌍 Public
Points on a Map
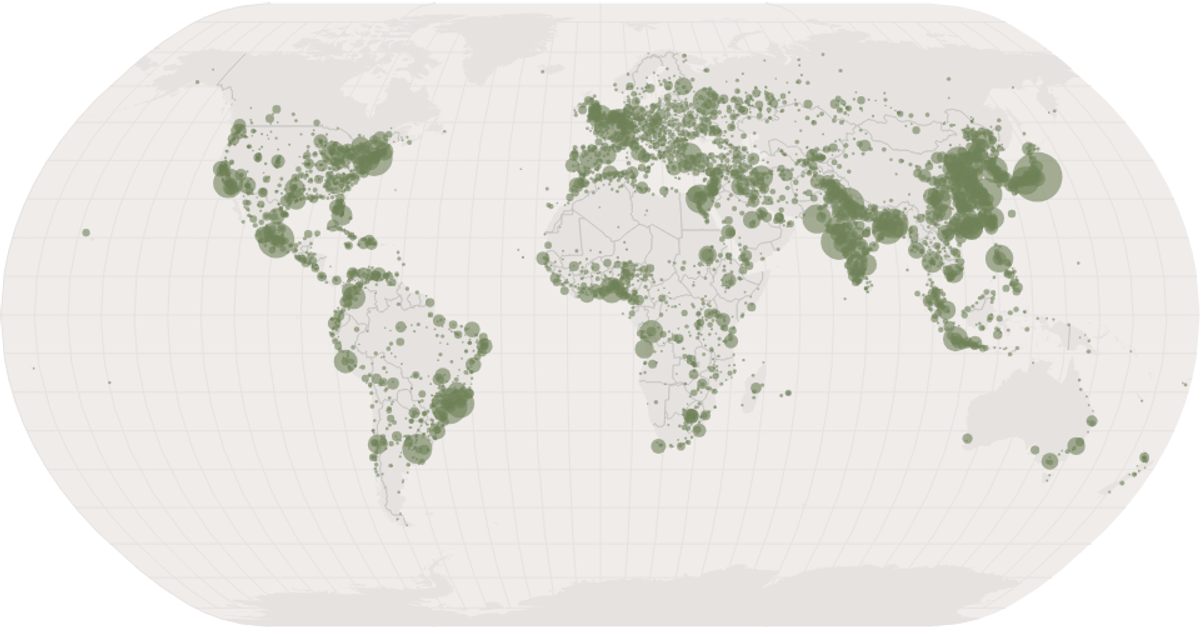
This example displays a world map with dots marking cities, sized proportionally to population via a square-root scale. The map uses a Natural Earth projection and includes graticules and country borders. The visualization is built with React and D3 v5, leveraging `geoNaturalEarth1`, `geoPath`, and `geoGraticule` for geographic rendering, while city data comes from the Data Canvas Sense Your City dataset. Circles are positioned using the projection and styled with opacity.
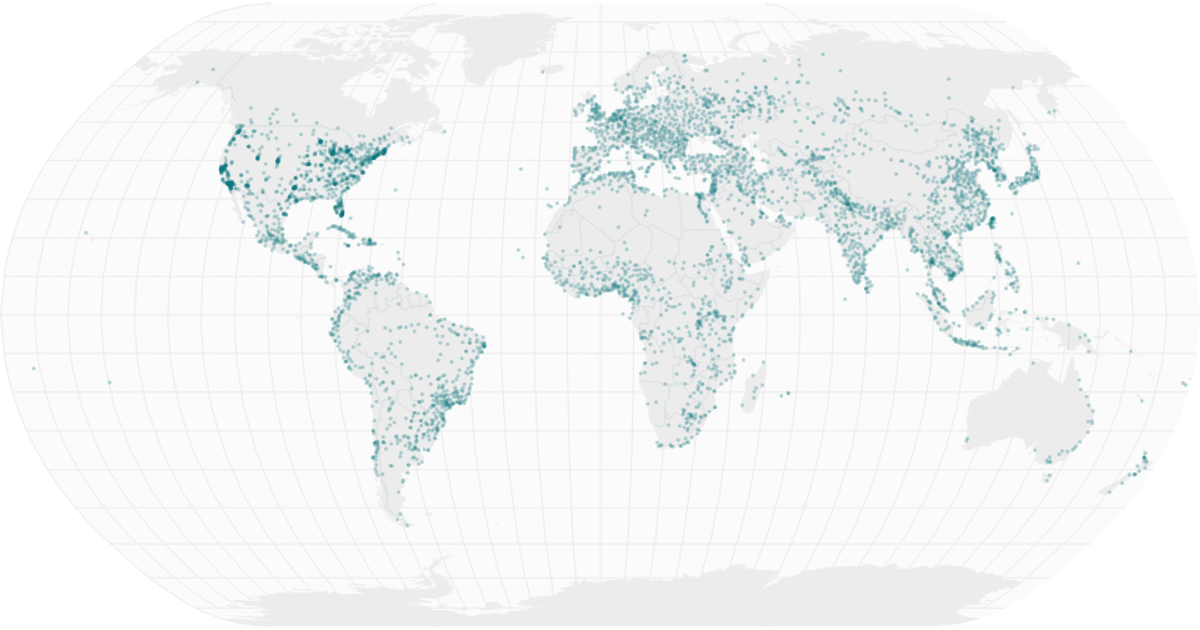
AI-generated descriptionA scatter plot of Data Canvas Sense Your City Dataset.
MIT Licensed




Comments
Sign in to join the discussion.