🌍 Public
5. Vega-Lite API Template
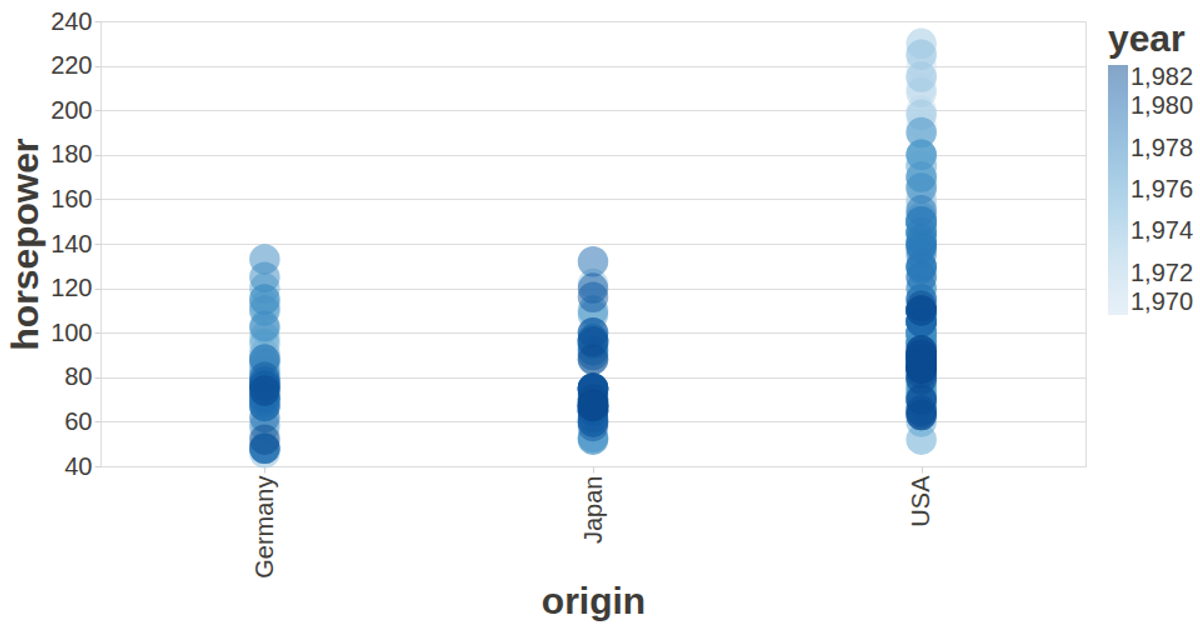
This visualization shows the relative gains of companies, plotting each as a circle whose size corresponds to weight and whose color indicates whether the gain is positive or negative. The chart is built with the Vega-Lite API, which registers Vega and Vega-Lite and renders an SVG view. Data is fetched as JSON from a gist and processed with D3’s `fetch` and `map` methods, while tooltips and axis styling are configured through the API. The visualization uses a dark-themed custom config to improve readability.
AI-generated descriptionA visualization constructed using the vega-lite-api.
MIT Licensed



Comments
Sign in to join the discussion.