🌍 Public
A6 ScatterPlot
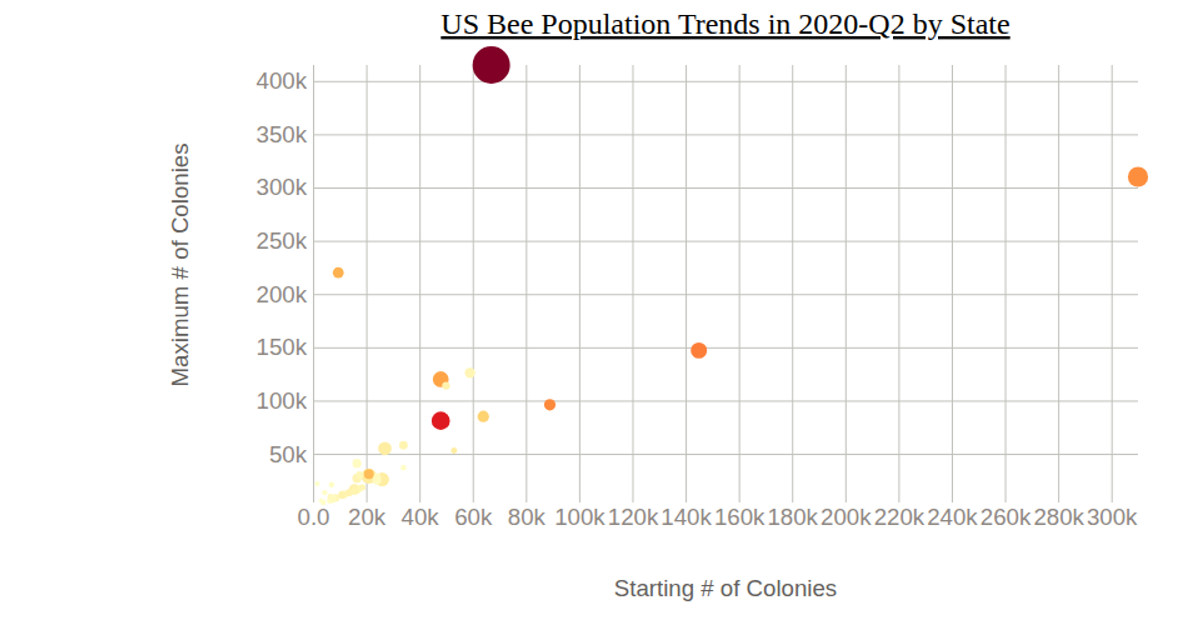
This scatterplot visualizes USDA NASS honey data from 2017–2021, plotting honey producing colonies (HPC) on a logarithmic x-axis against yield per colony (YPC) on a linear y-axis, with points colored by year using an ordinal color scale and a vertical legend. The chart uses D3 v7 with SVG rendering, employing `d3.scaleLog`, `d3.scaleLinear`, and `d3.scaleOrdinal` to map data, and `d3.axisBottom` and `d3.axisLeft` for axes. The `d3.legendColor` API adds the color legend, while circles are drawn with `join("circle")` and styled with stroke and fill attributes.
AI-generated descriptionMIT Licensed




Comments
Sign in to join the discussion.