🌍 Public
Test of scatter plot
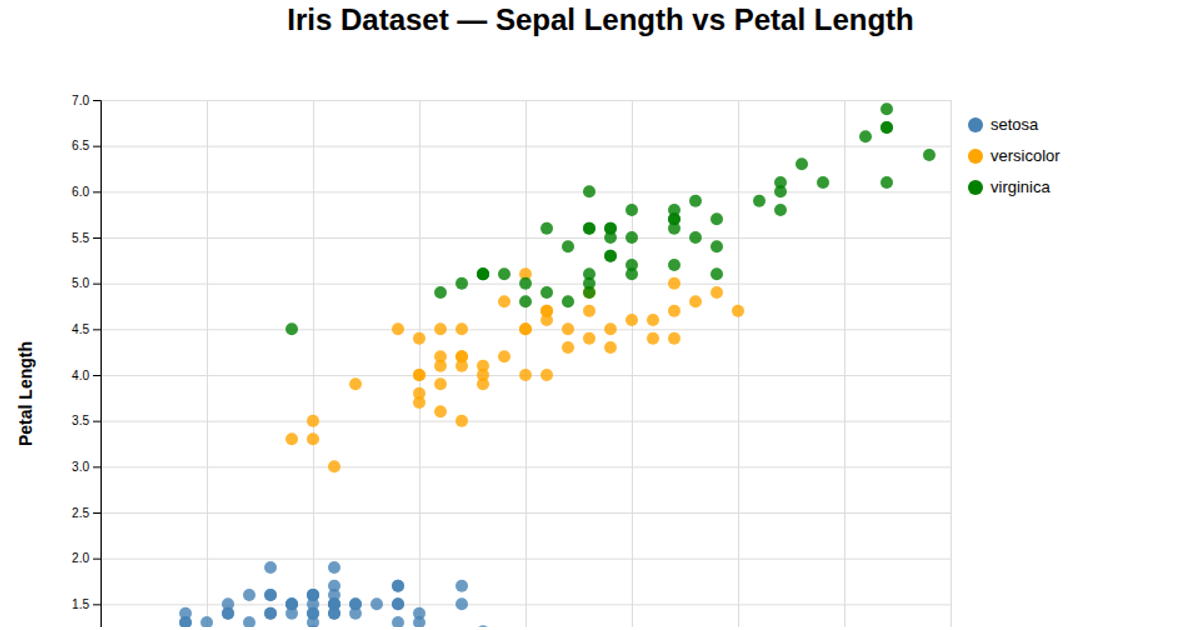
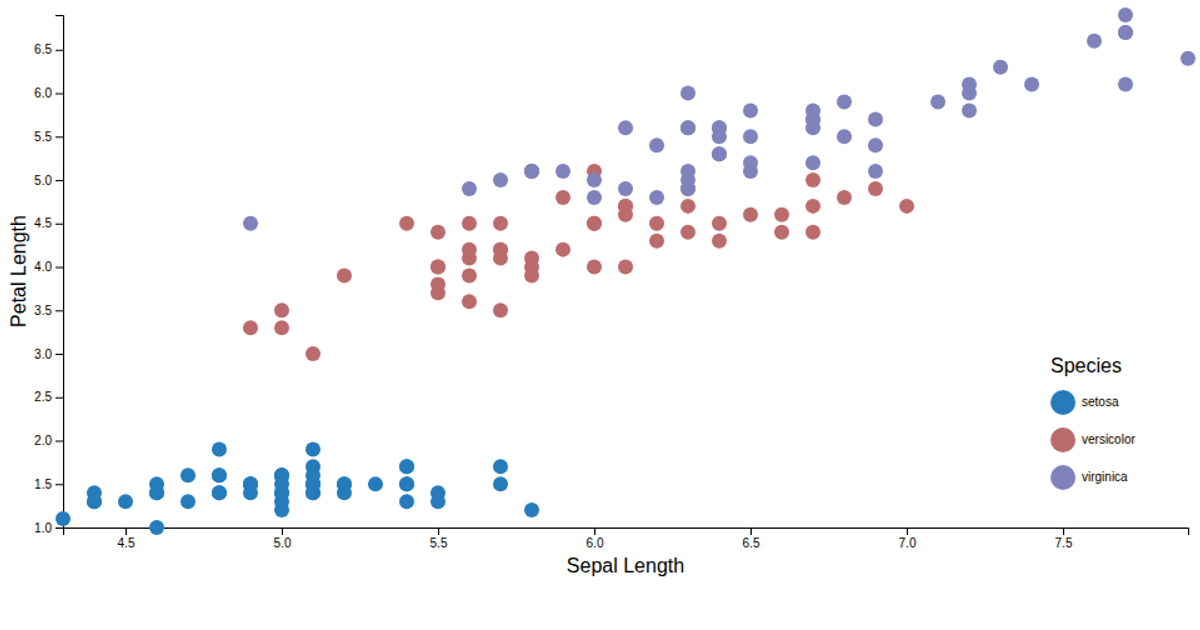
This scatter plot shows the relationship between sepal length and petal length for iris flowers, with each point colored by species. A color legend on the right can be hovered to highlight matching points while dimming the rest. Built with d3 scaleLinear, scaleOrdinal, and schemeCategory10, it renders axes via axisLeft and axisBottom, and draws data marks as SVG circles.
AI-generated descriptionTesting scatter plot
MIT Licensed




Comments
Sign in to join the discussion.