🌍 Public
Fork of Directed cyclic dependency graph (POC)
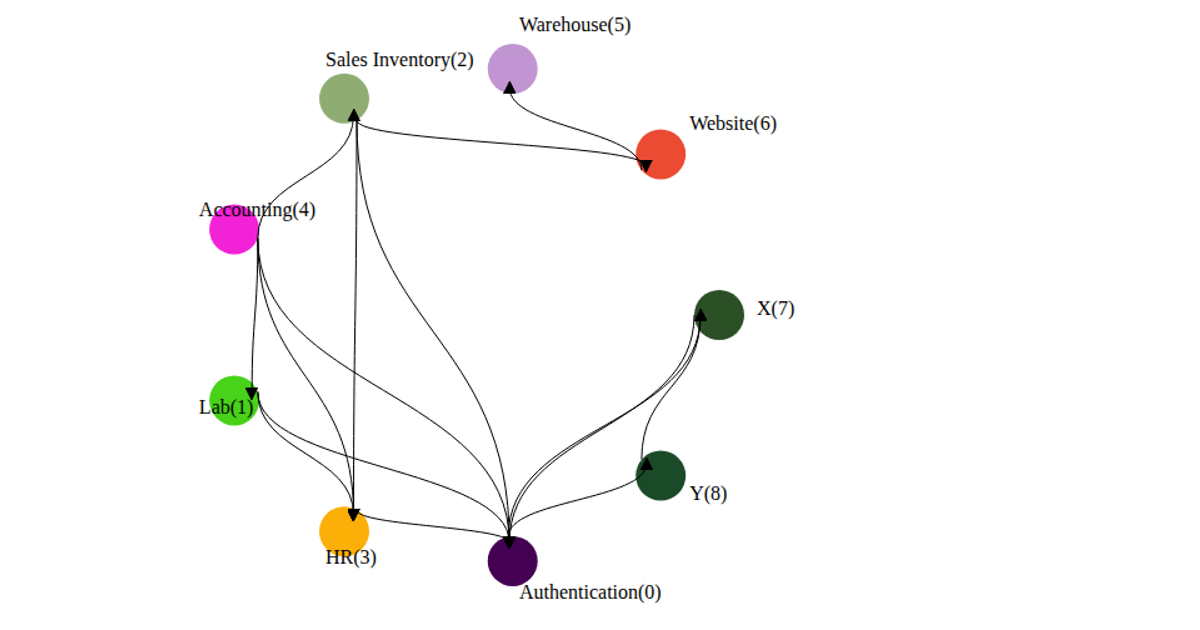
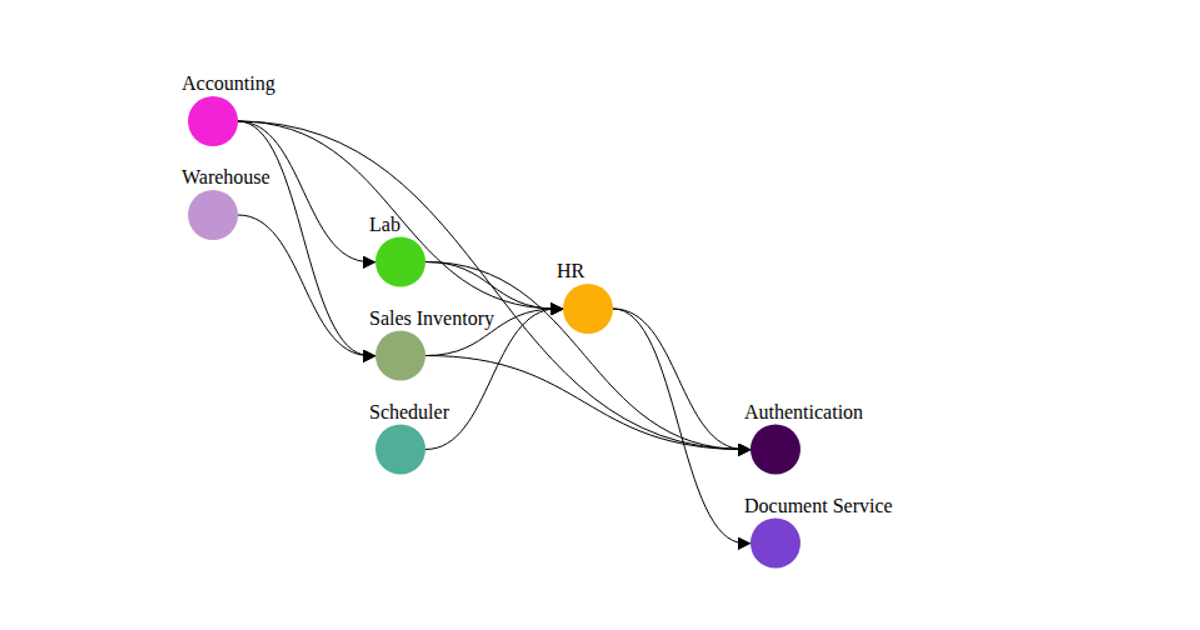
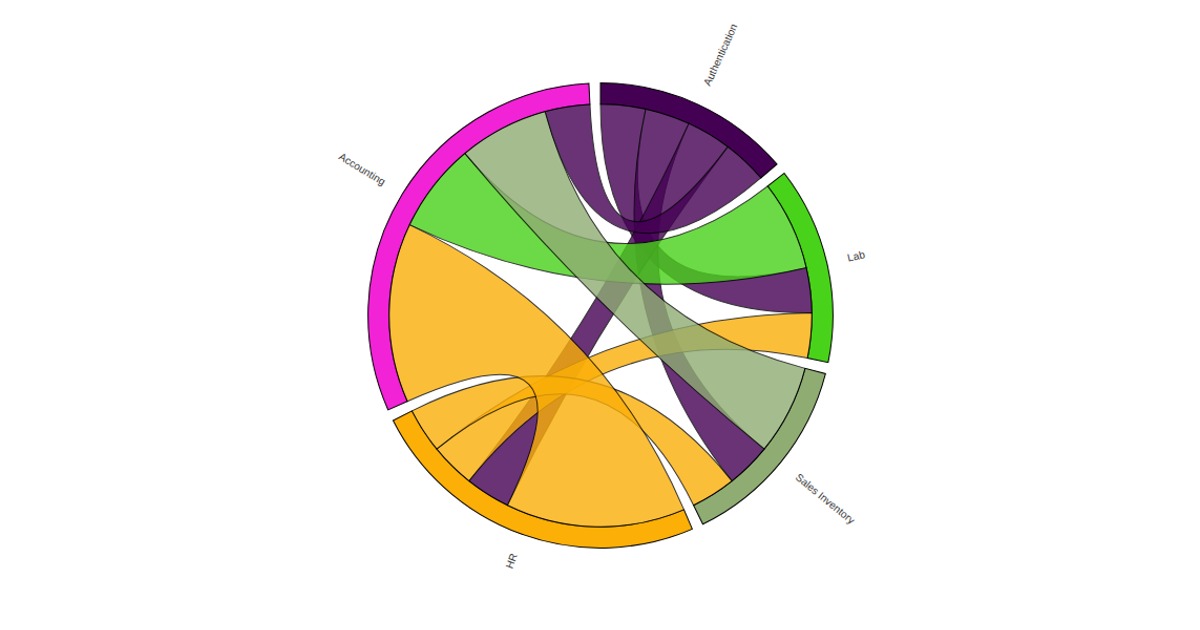
A dependency graph visualizes the sequential flow of financial data items, from chart of accounts through vendors, purchase orders, invoices, and expense transactions. The D3.js v5 code loads items from a JSON data file and renders them as connected circular nodes, with arrows indicating dependencies. Node positions are determined by a predefined sequence, and the visualization supports interactive dragging to rearrange nodes, with linked edges and labels updating accordingly. The SVG rendering uses D3's selection, filtering, and event-handling APIs to manage the dynamic graph layout.
AI-generated descriptionMIT Licensed



Comments
Sign in to join the discussion.