🌍 Public
Showing World Population with D3
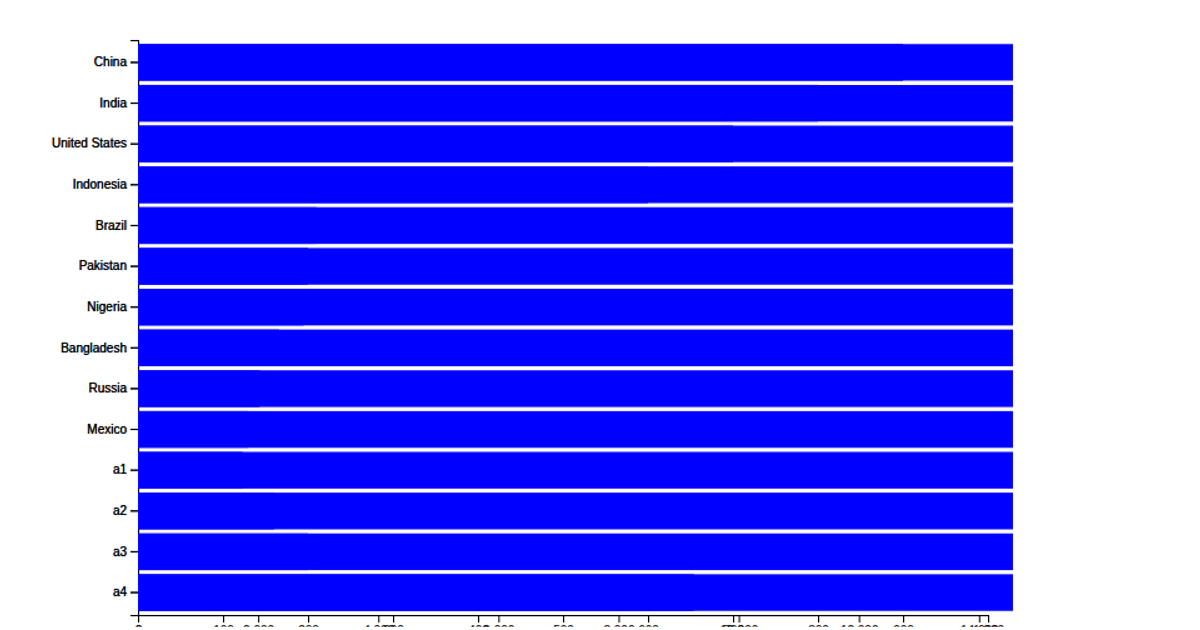
This example displays world population data as a series of static rectangular bars, each representing a country’s population value loaded from a local CSV file. Using D3 v7, the code parses the data with `d3.csv`, converts population strings to numbers, and renders SVG `<rect>` elements via `selectAll` and data joins. A `d3.scaleLinear` is configured for the x-axis domain, though the bars currently use fixed dimensions and do not yet map population values to visual properties.
AI-generated descriptionMIT Licensed







Comments
Sign in to join the discussion.