🌍 Public
Fork of ICE8
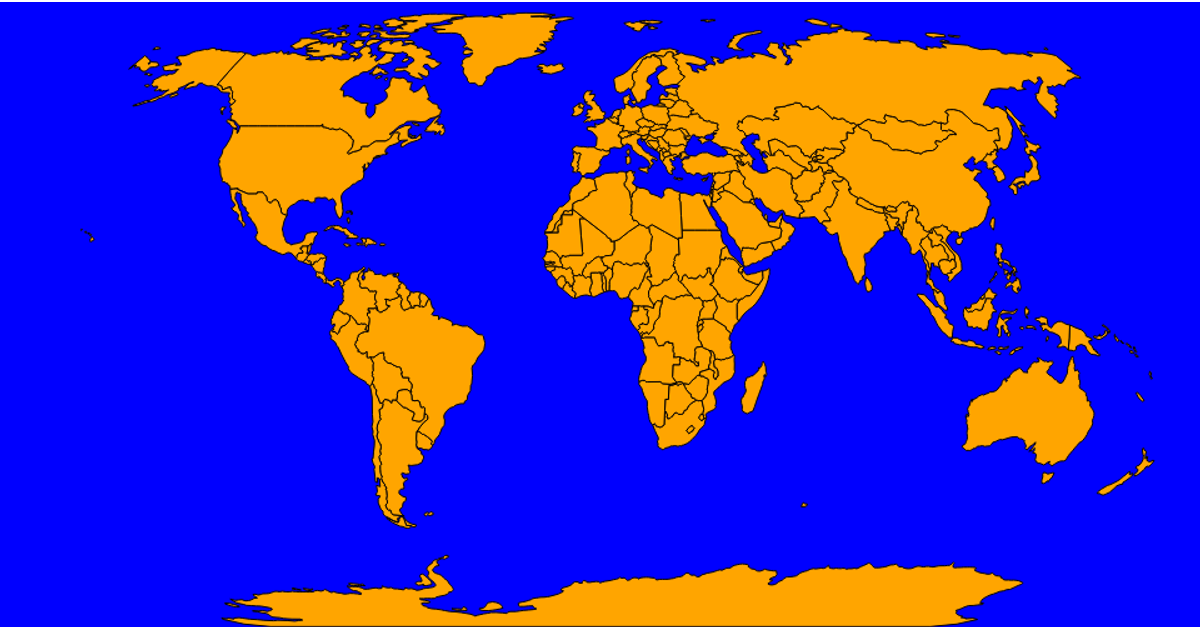
This world choropleth displays a static color-coded map of countries, with data provided inline in the code rather than through an external CSV file. The visualization uses D3.js version 7 to render the geographic boundaries via `d3.geoPath` and applies sequential color scales to encode values. It relies on the TopoJSON client library to load and convert geographic data for the map’s projection. A hover tooltip is implemented using a fixed overlay that shows details, though no value labels are present on the map itself.
AI-generated descriptionMIT Licensed



Comments
Sign in to join the discussion.