🌍 Public
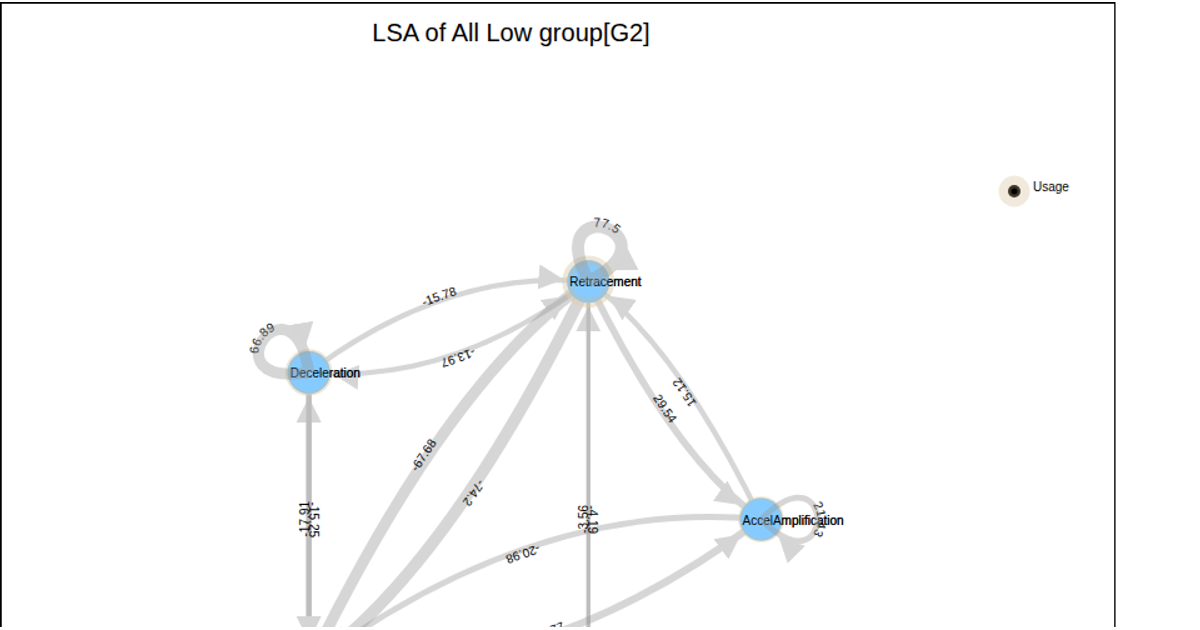
LSA-G2
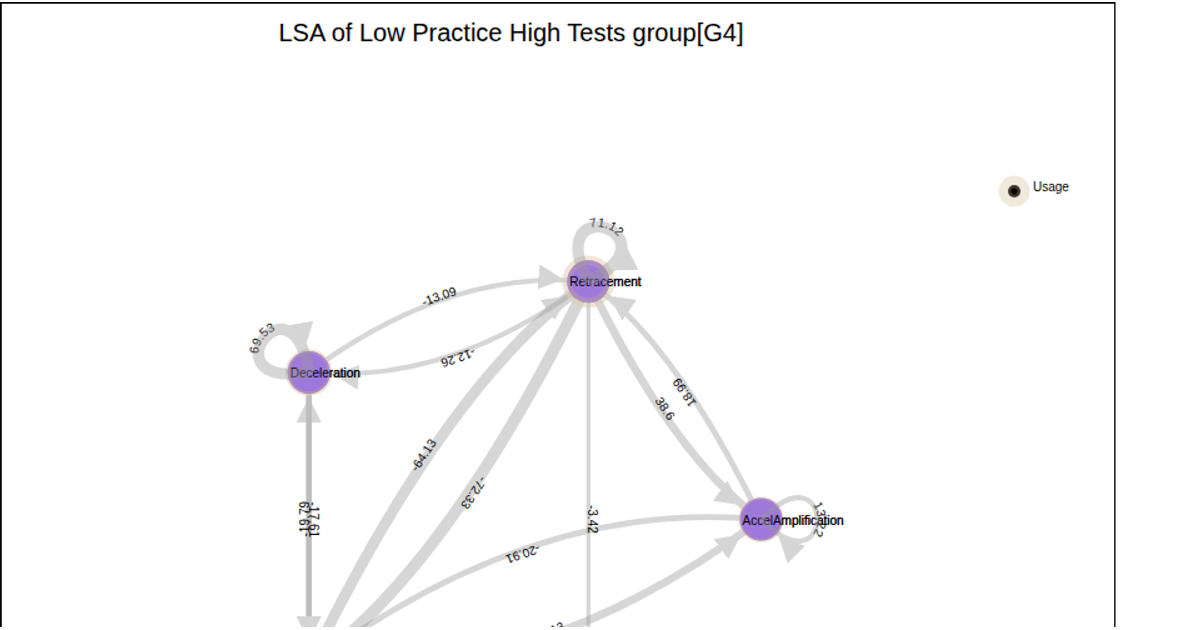
A force-directed knowledge graph visualization displays the Latent Semantic Analysis (LSA) results for the low group G2. Five nodes, representing concepts like 'Break' and 'Retracement', are arranged in a circular layout with edges showing weighted relationships between them. The graph uses self-loops and directed links with arrowheads to indicate the strength and direction of semantic associations, encoded by edge labels and node size. Built with D3.js v5, the visualization uses SVG rendering and positions nodes via a circular layout computed from the dataset.
AI-generated descriptionMIT Licensed


Comments
Sign in to join the discussion.