🌍 Public
lets make a face
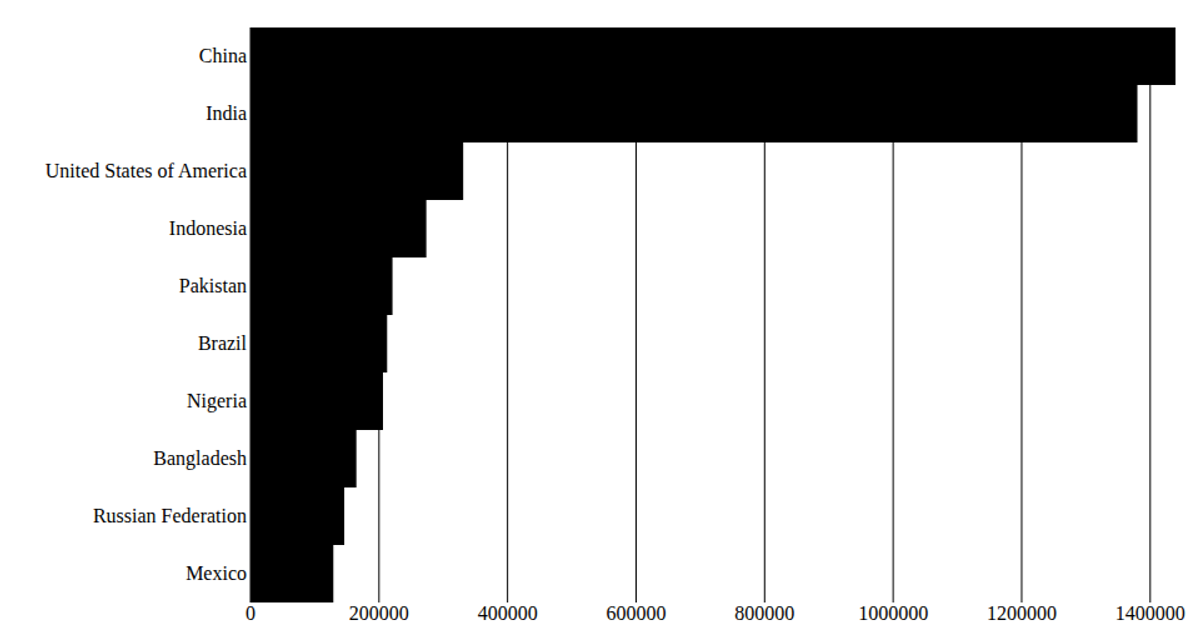
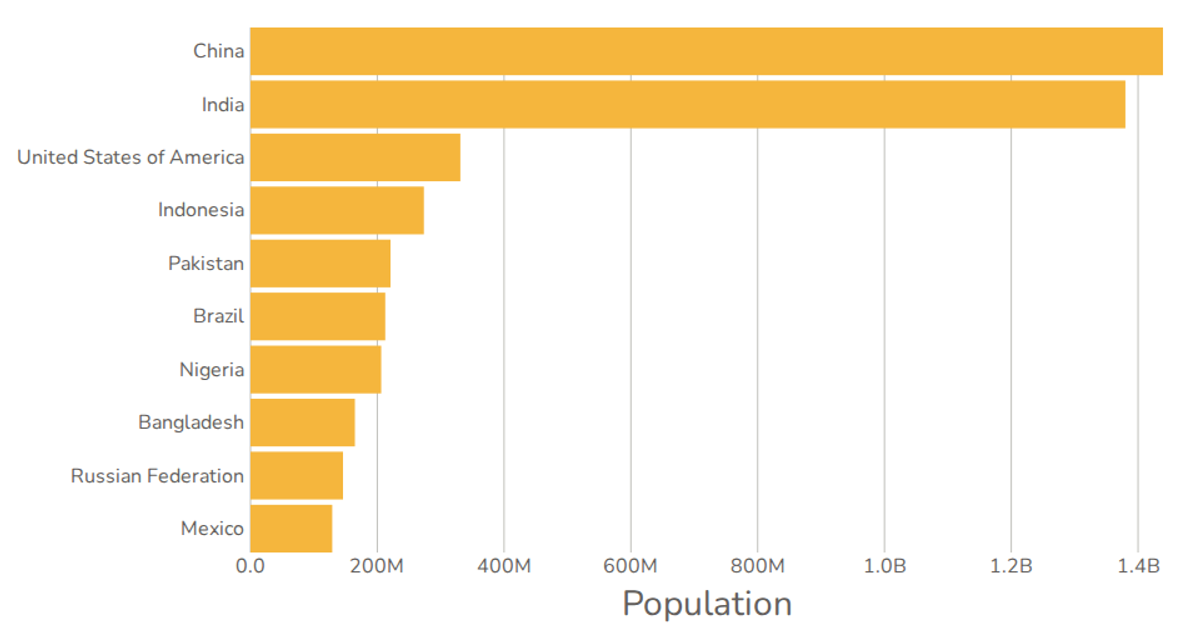
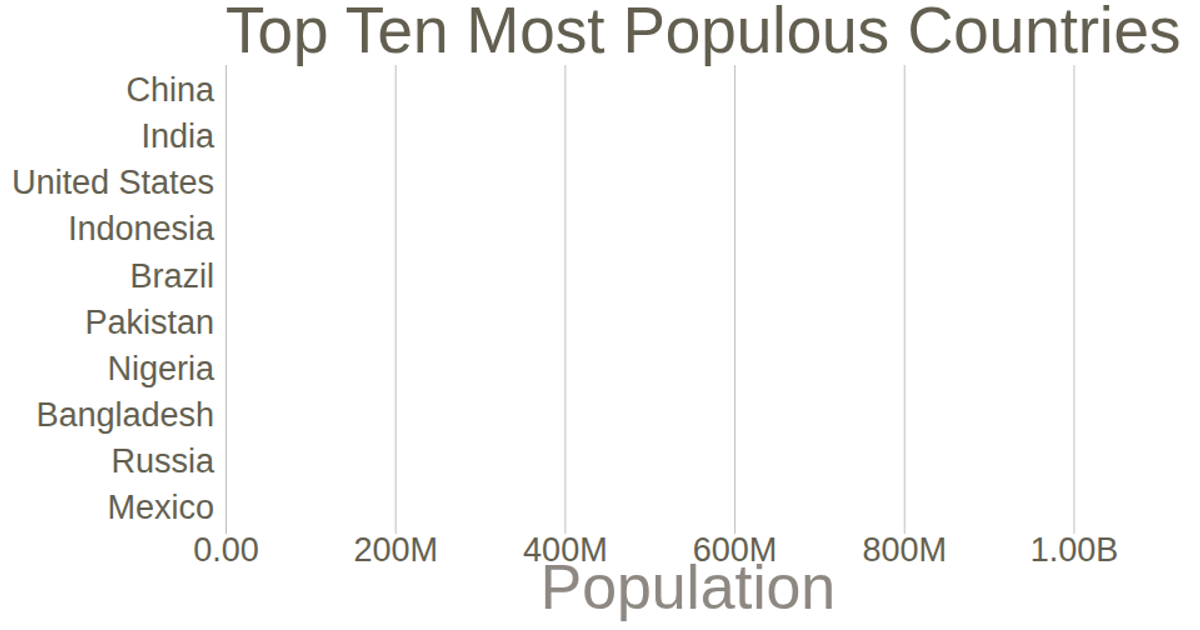
This example presents the world’s top 10 most populous countries as a simple, axis-free bar chart. It uses React with D3 v7 to render SVG bars, scaling the data from the United Nations World Population Prospects 2019. The code employs `scaleBand` for bar positioning, `scaleLinear` for heights, and `max` for domain calculation.
AI-generated descriptionA program that shows the top 10 most populous countries as a pathetic bar chart with no axes.
MIT Licensed




Comments
Sign in to join the discussion.