🌍 Public
Customizing Axes
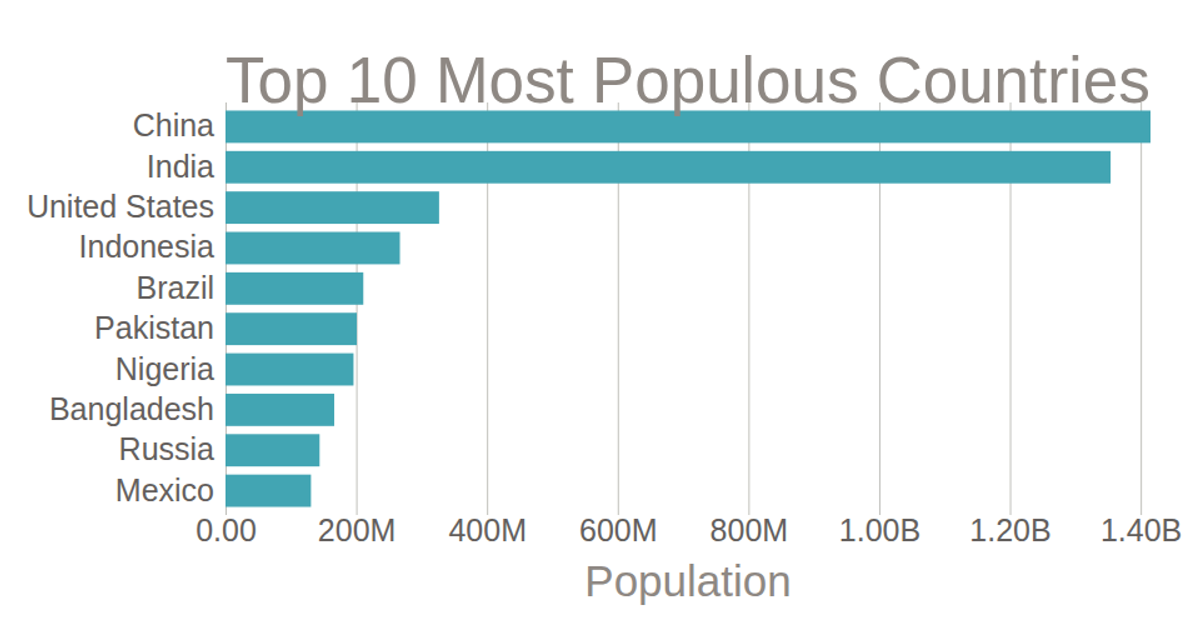
This horizontal bar chart displays the population of the top 10 most populous countries, using a linear scale for population and a band scale for country names. It customizes axis formatting with `d3.axisBottom` and `.tickFormat` to abbreviate numbers (e.g., "1.42B"), and removes default axis lines. The chart includes interactive checkboxes to toggle country visibility, though the filtering logic is not implemented. Data is loaded from `data.csv` via `d3.csv`, with population values multiplied by 1000. The SVG rendering uses `d3.scaleLinear`, `d3.scaleBand`, and `d3.axisLeft`.
AI-generated descriptionMIT Licensed




Comments
Sign in to join the discussion.