🌍 Public
Bar Chart using D3.js
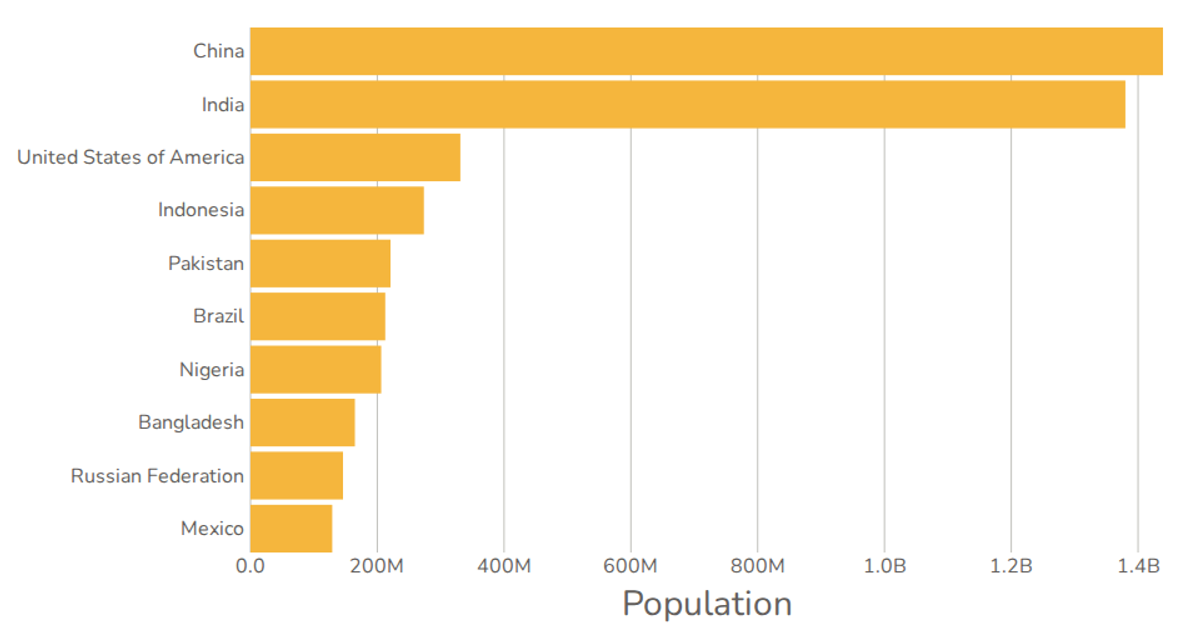
This bar chart displays the top 10 most populous countries using United Nations World Population Prospects 2019 data. The visualization uses D3.js v4 to render SVG rectangles, with `d3.csv` loading the dataset and a custom React hook managing the data state. The chart employs an ordinal y-scale for country categories and a linear x-scale for population values, with tooltips showing exact figures. The code also includes a separate D3.js example using an array of numbers, demonstrating both React-integrated and standalone D3 approaches to bar chart creation.
AI-generated descriptionA program that shows the top 10 most populous countries as a bar chart.
MIT Licensed




Comments
Sign in to join the discussion.