🌍 Public
percentage of individials with digital skills
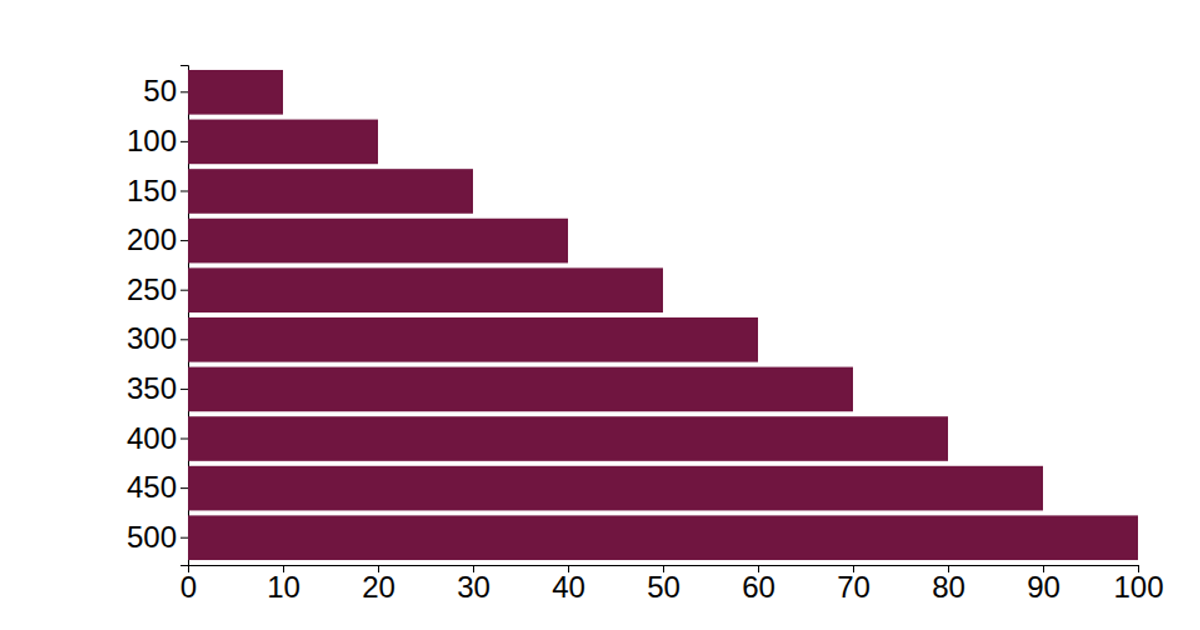
This visualization shows the percentage of individuals with various digital skills across different European Union country groupings in 2015, with each skill category represented as a horizontal bar. The data is loaded from a CSV file and rendered as an SVG bar chart using D3 v5. The code uses `scaleLinear` for the x-axis, `scaleBand` for the y-axis, and `axisLeft` and `axisBottom` to display the axes. Each bar’s width is mapped to the percentage value, and the color is a fixed steelblue.
AI-generated descriptionMIT Licensed



Comments
Sign in to join the discussion.