🌍 Public
Assignment 7 -- Adjacency Matrix
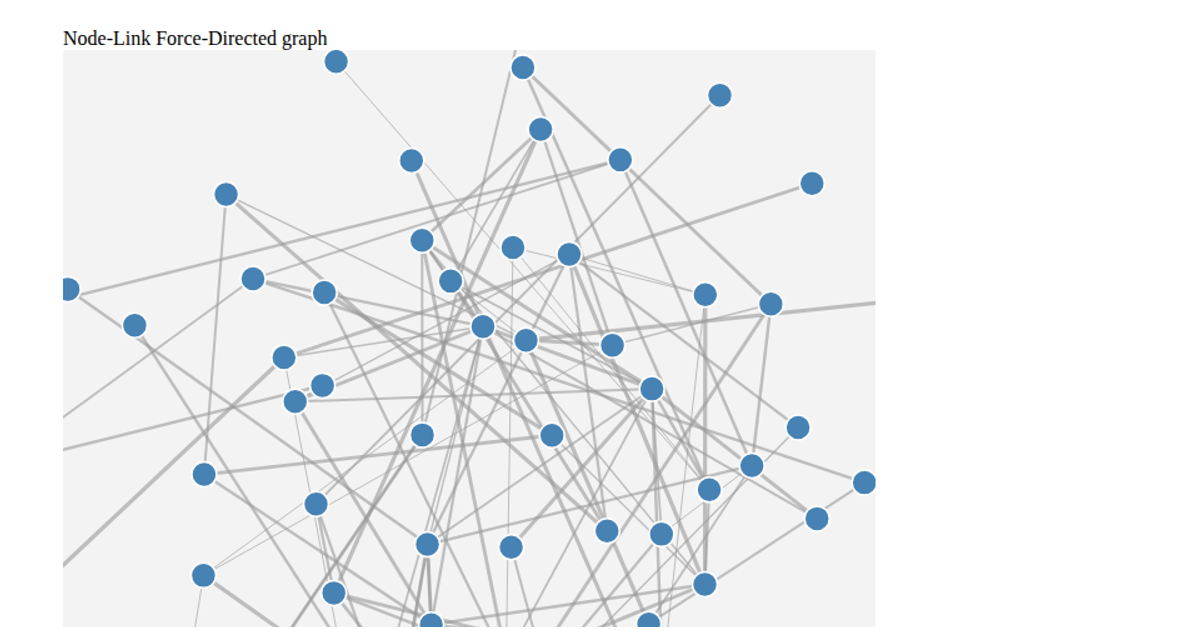
This example pairs a force-directed node-link diagram with an adjacency matrix to explore connections between U.S. states. The matrix encodes link strength with color opacity and groups states by region, with cells colored by group membership. Users can reorder matrix rows and columns by link count or name via a dropdown, triggering animated transitions. The visualization uses d3.v3 with `d3.layout.force` for the node-link view and ordinal/linear scales for the matrix, rendering in SVG. Data comes from a custom `miserables.json` file.
AI-generated descriptionMIT Licensed




Comments
Sign in to join the discussion.