🌍 Public
Chiasm Crossfilter Integration
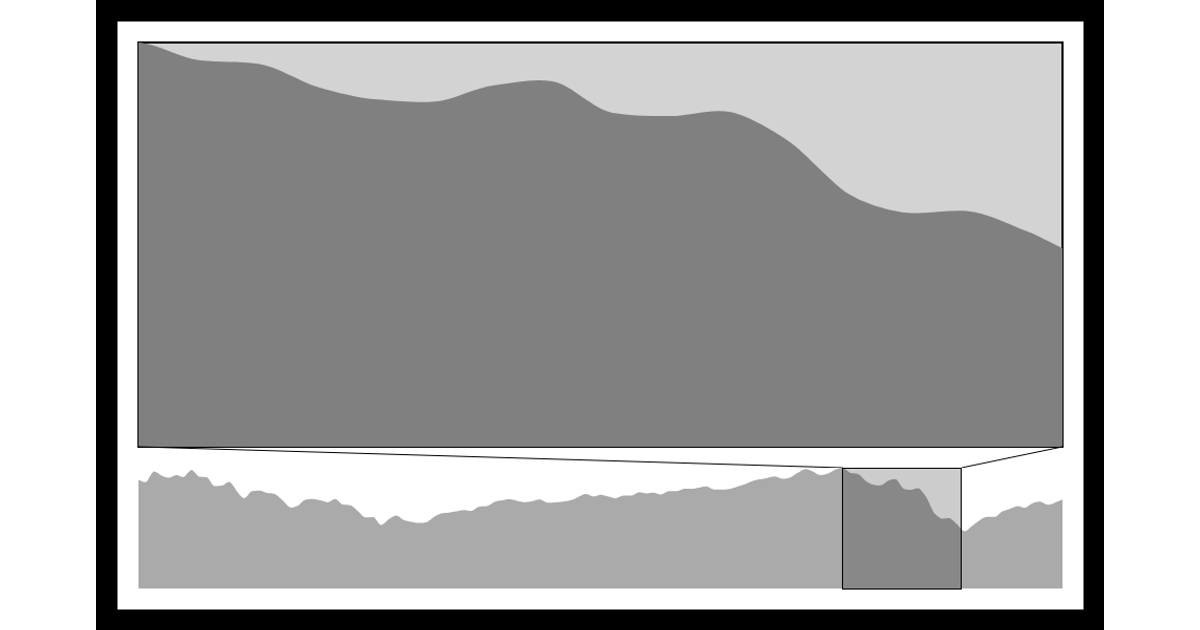
This example shows a linked crossfilter dashboard with a Leaflet bubble map and a bar chart, driven by Chiasm’s reactive component architecture. Brushing the bar chart filters the map’s circles by date, using `ChiasmCrossfilter` to aggregate event data by month and latitude/longitude. D3 v3 renders the bar chart and map, while the layout plugin manages the vertical split and the dataset loader fetches the `events` data. Crossfilter 1.3.12 handles multidimensional filtering across the two visualizations.
AI-generated descriptionMIT Licensed







Comments
Sign in to join the discussion.