🌍 Public
Fork of Missing Migrants Date Histogram
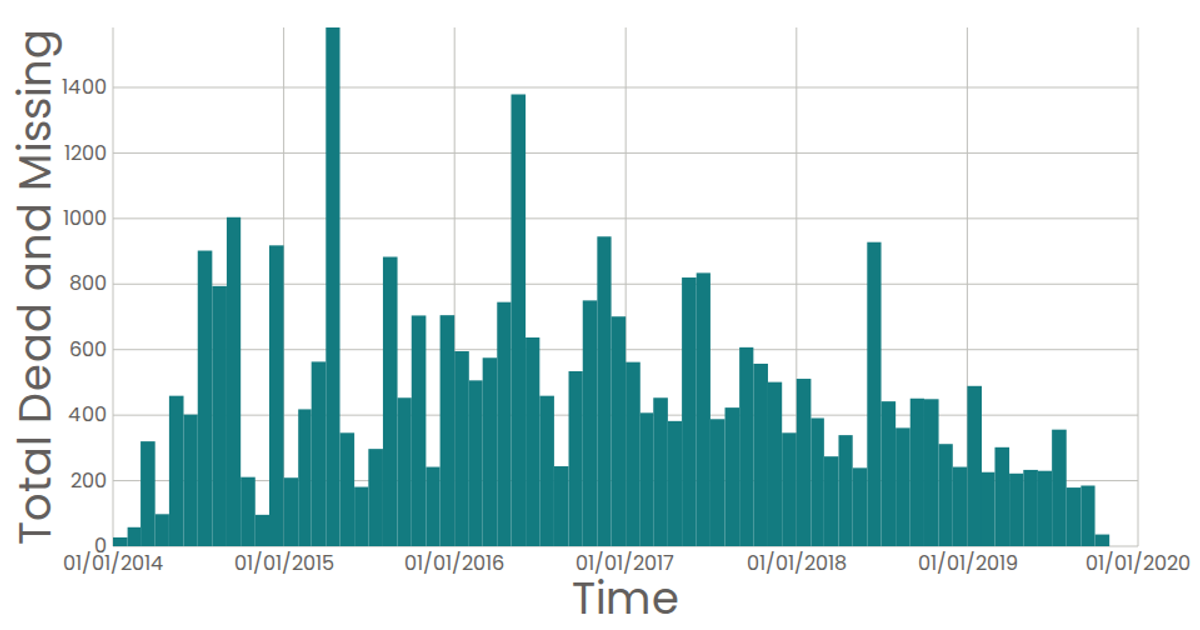
This histogram visualizes the monthly total of dead and missing migrants, using data from the Missing Migrants Dataset. The React application loads the data via `d3.csv` and displays the counts as vertically positioned rectangles. The visualization uses D3 v5's `scaleTime`, `histogram` (via `bin()`), and `sum` to aggregate the data by month, with axes rendered as SVG elements. Time is shown on the x-axis, and the counts are on the y-axis, with a tooltip revealing the exact sum for each bar.
AI-generated descriptionA date histogram showing the sum total dead and missing migrants for each month.
Data from the Missing Migrants Dataset.
MIT Licensed




Comments
Sign in to join the discussion.