🌍 Public
Fork of ICE7 Pie Charts
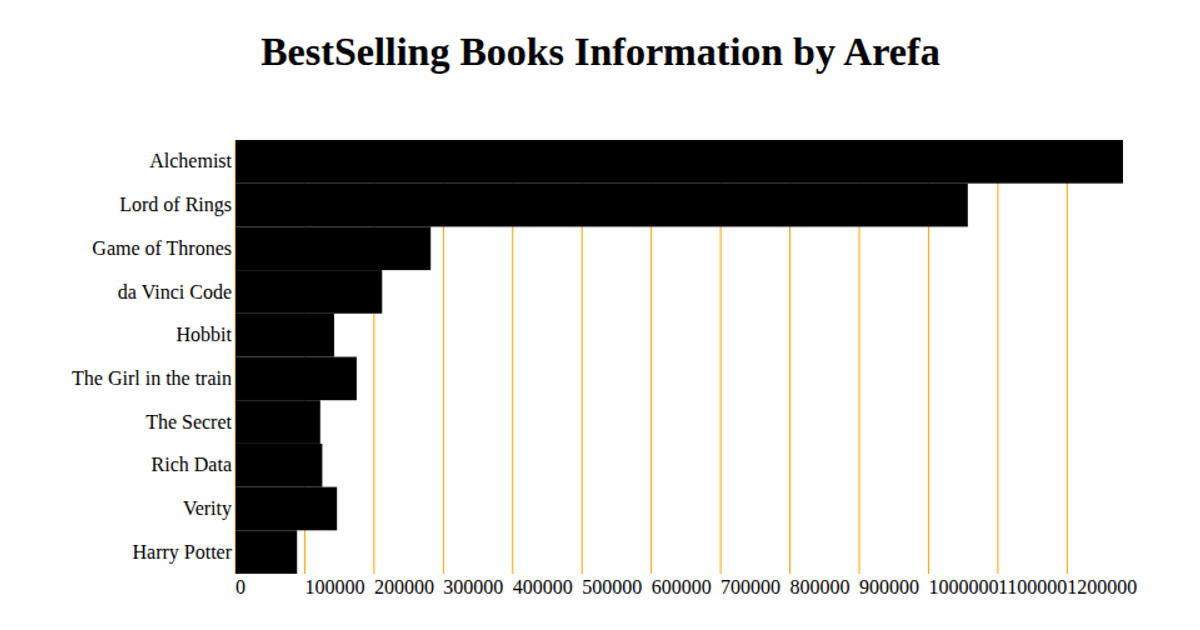
This fork of ICE7 Pie Charts displays a horizontal bar chart ranking cities by their book counts, using data loaded from a CSV file. The visualization initially shows a loading state before rendering ten bars with a blue x-axis grid and labeled y-axis. Built with React and D3, the code employs `d3.csv` for data parsing, `scaleBand` and `scaleLinear` for positioning, and SVG elements to draw the bars and ticks.
AI-generated descriptionMIT Licensed




Comments
Sign in to join the discussion.