🌍 Public
Religion Choropleth Map
This animated choropleth map visualizes the dominant religion in each country using a rotating orthographic globe. Country polygons are colored via a categorical scale, with gray indicating missing data. The visualization uses D3’s `geoOrthographic`, `geoPath`, `geoGraticule`, `scaleOrdinal`, and `schemeCategory10`, with an interactive legend from `colorLegend.js` that filters highlights on hover. Data comes from a 2020 CSV of religions by country, merged with country shapes from the visionscarto-world-atlas TopoJSON, fetched using `Promise.all` and parsed with `csvParse`.
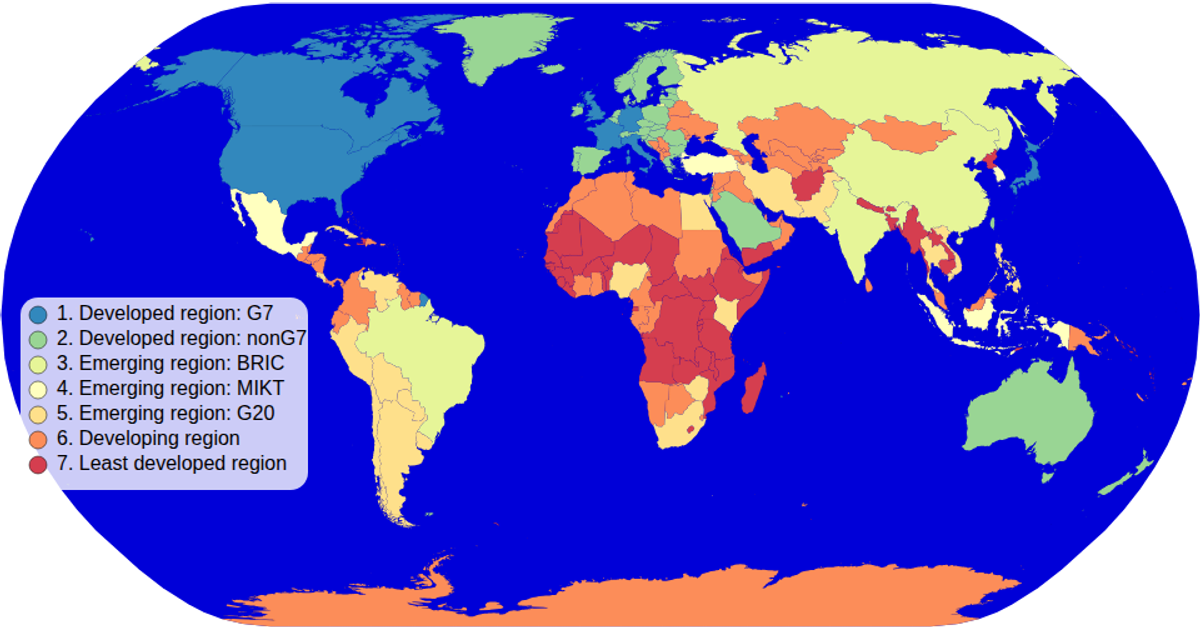
AI-generated descriptionA choropleth map of World Bank Dataset: GDP per capita, PPP (current international $).
See also:
- Wikipedia: List of countries by GDP (PPP)
- World Bank: GDP per capita, PPP (current international $)
- GitHub Gist: World Bank Dataset: GDP per capita, PPP (current international $)
- MDN: String.prototype.substring()
- MDN: Promise.all
- MDN: Map
- d3.scaleQuantile
- Wikipedia: Quantile
- d3-scale-chromatic
- ColorBrewer
MIT Licensed




Comments
Sign in to join the discussion.