🌍 Public
Fork of HTML Starter
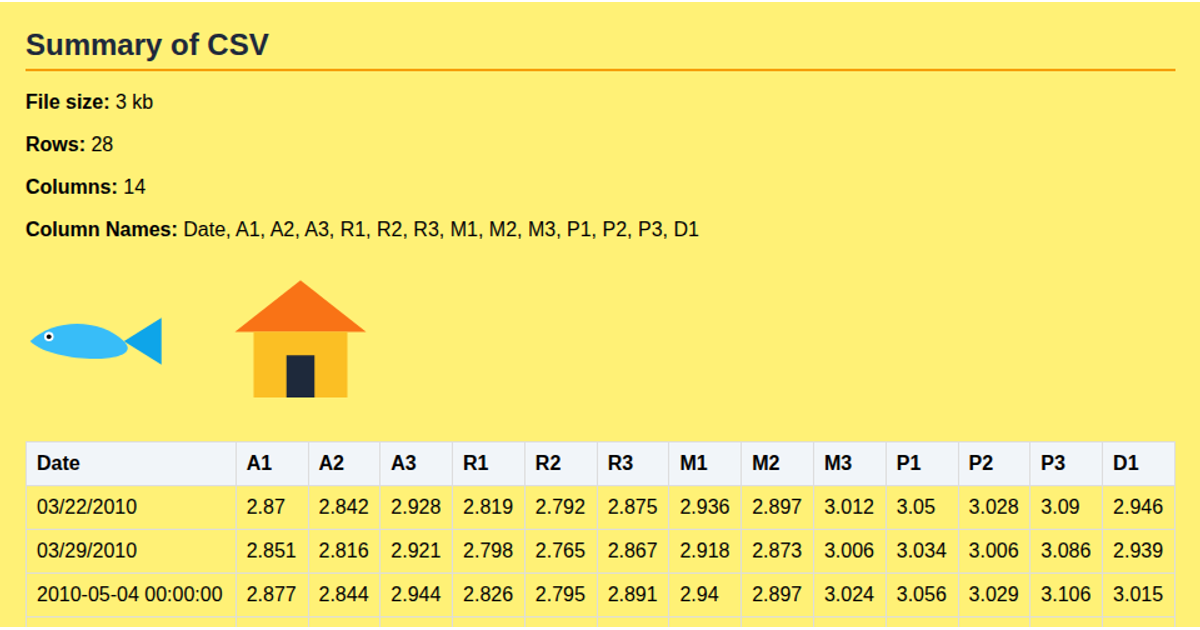
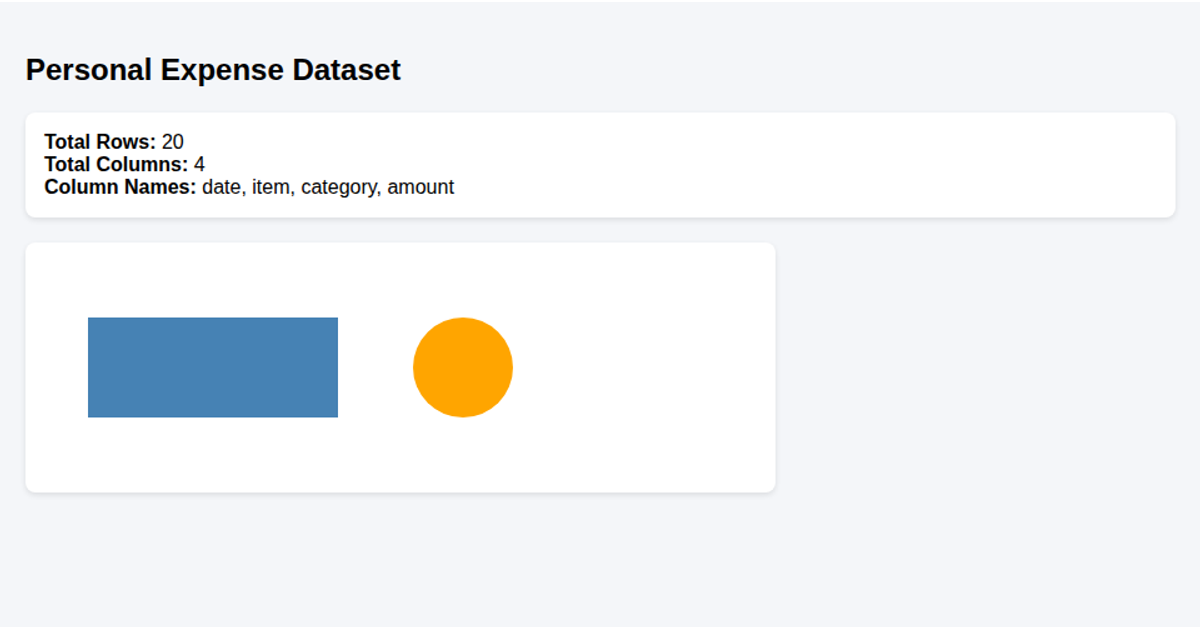
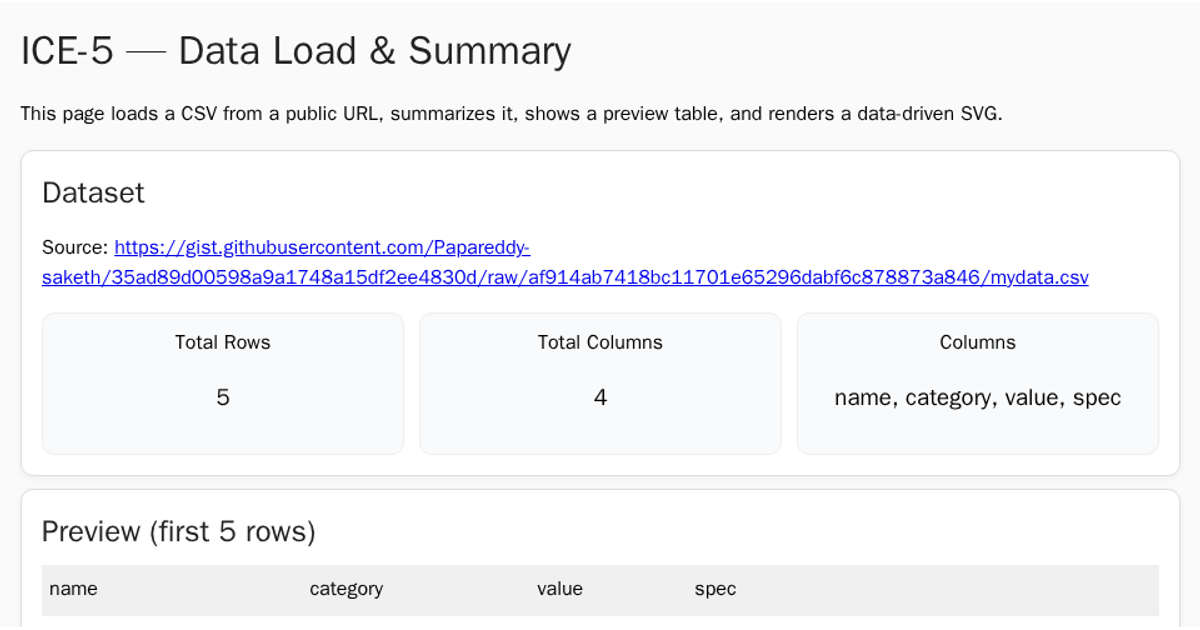
This example shows a simple HTML table of shape data alongside a static SVG graphic containing a red circle, a blue rectangle, and a green polygon. The page summarizes the dataset with a total shape count and the average area. The visible code uses SVG shapes and a JavaScript `fetch` call to load a CSV file from a GitHub gist, dynamically populating the table and computing the summary from the parsed rows.
AI-generated descriptionMIT Licensed



Comments
Sign in to join the discussion.