🌍 Public
Let's make a World Map - Cholropleth with interactions
JJimMaltby
Last edited Oct 27, 2020
Created on Oct 25, 2020
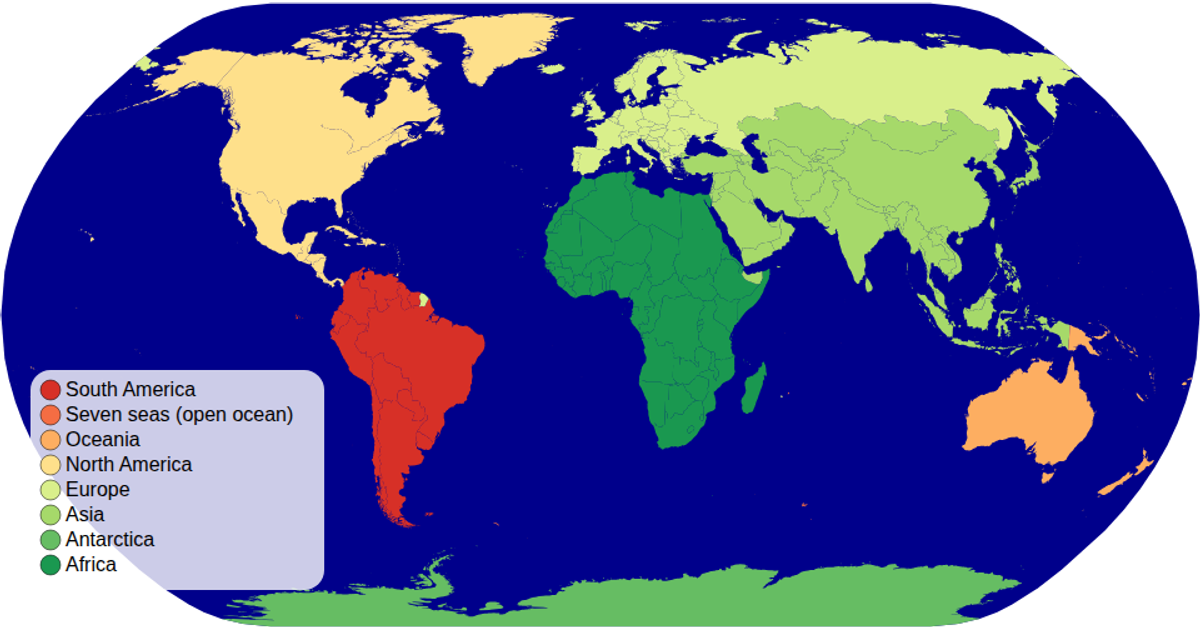
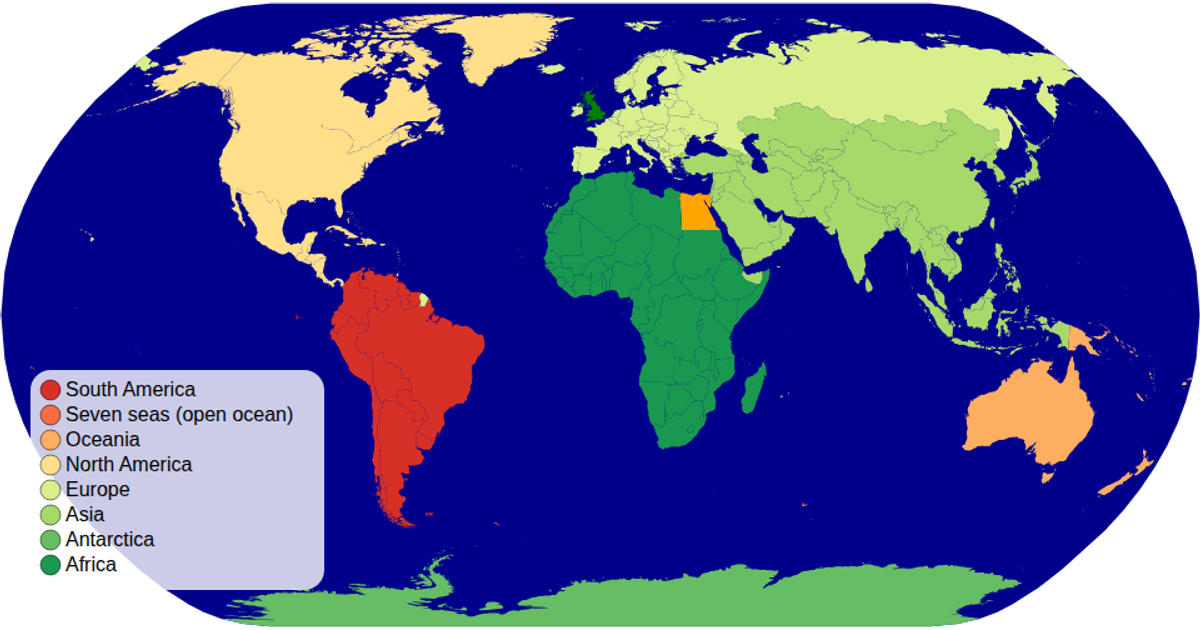
This choropleth world map colors each country by its economy classification using a diverging color scale. Users can zoom and pan the map, and hovering over a country reveals its name, economy type, and continent in a tooltip. The visualization uses d3.geoPath with a natural Earth projection, d3.zoom for interactions, and d3.scaleOrdinal with the RdYlGn scheme. It renders geographic data from the world-atlas TopoJSON and TSV datasets, with a custom color legend built using D3’s join pattern.
AI-generated descriptionA Cholropleth with interactions map of the world. From Curran Kelleher's: "Cholropleth Map with D3" .
MIT Licensed


Comments
Sign in to join the discussion.