🌍 Public
Dynamic D3 Scatterplot with Symbols
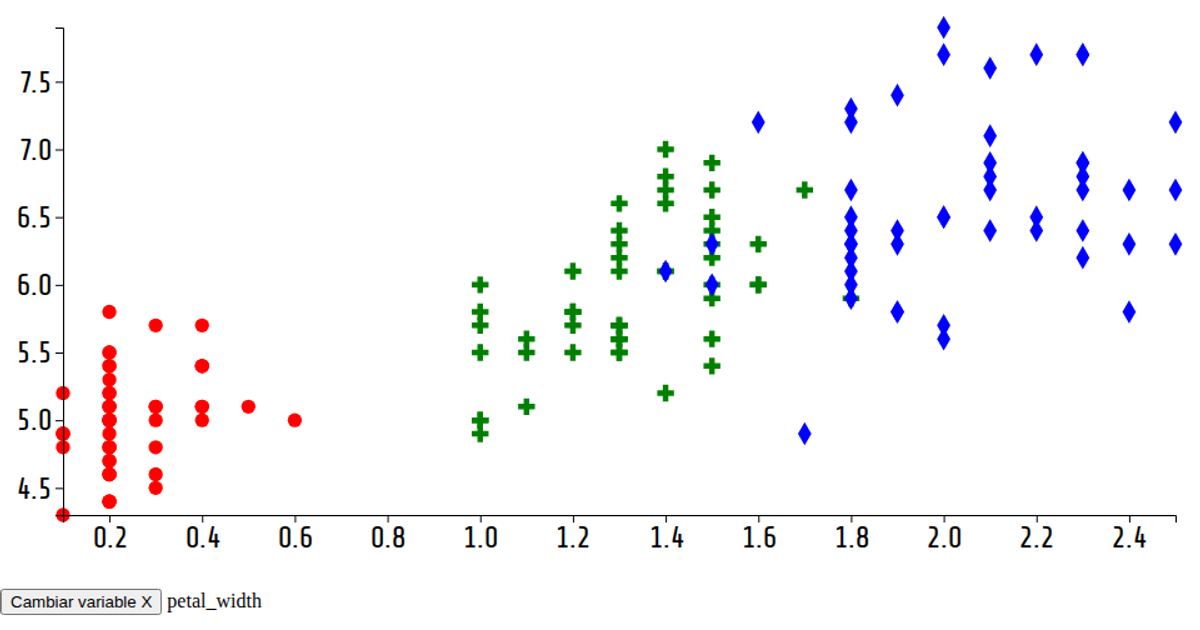
This interactive scatterplot animates through the Iris dataset, cycling the x-axis across four measured attributes every two seconds. It uses D3 scales and SVG symbols to encode species with both color and distinct shapes. The visualization leverages a reusable scatterplot function that re-renders on each interval, with axes updating dynamically. The data is loaded via D3’s CSV parser, and the plot uses ordinal scales for categorical color and symbol assignment.
AI-generated descriptionA bare minimum HTML page demonstrating use of CSS and JavaScript.
See also React Starter.
MIT Licensed




Comments
Sign in to join the discussion.