🌍 Public
Multi-Series Chart by Mohith
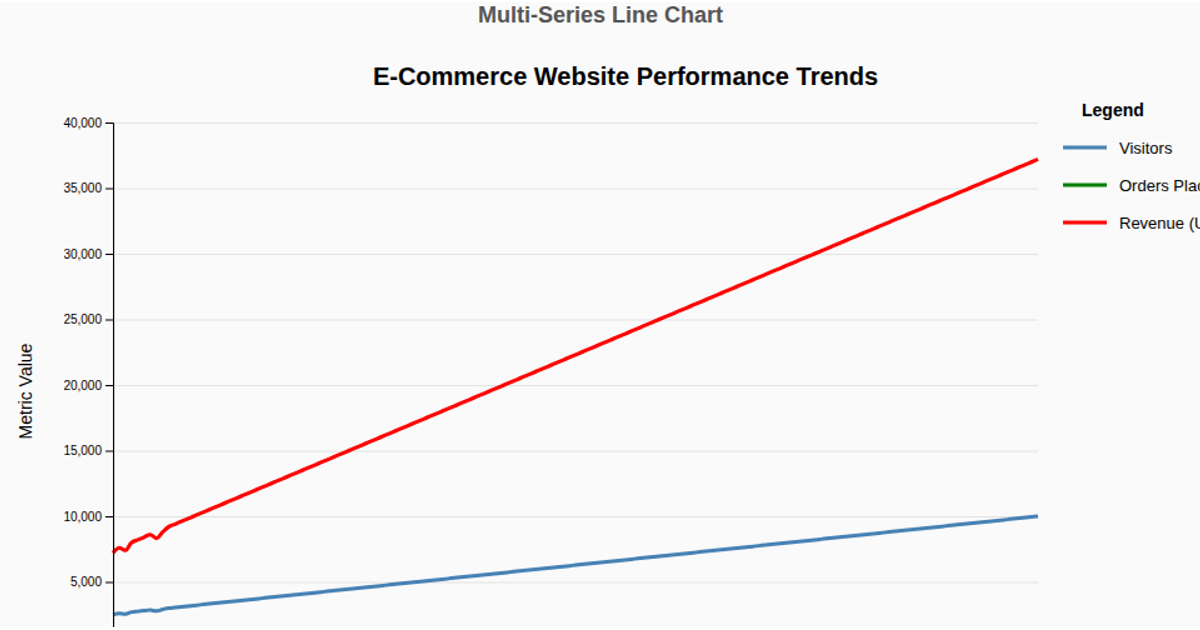
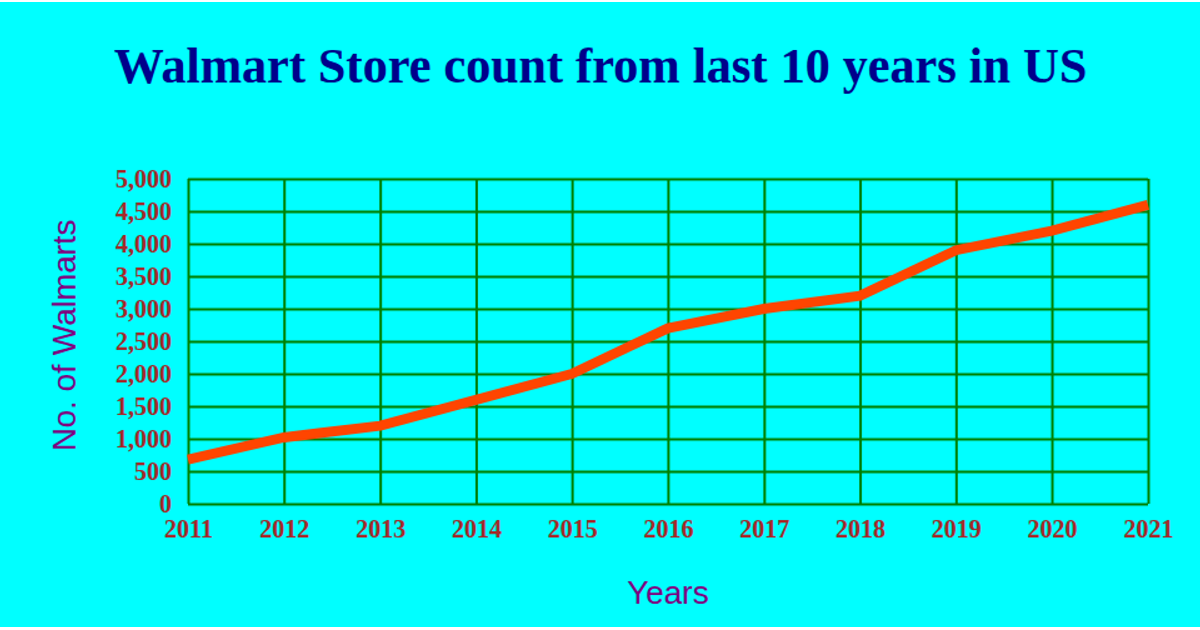
This multi-series line chart displays Walmart's monthly Sales, Profit, and CustomerTraffic data from a CSV file, plotting each metric as a colored line over the months. The visualization uses hard-coded keys and colors to distinguish series, with all lines sharing a common linear y-scale. Built with D3 v7, the code loads the data via `d3.csv`, creates scales using `d3.scaleBand` and `d3.scaleLinear`, and renders the lines with `d3.line`. It also includes axes via `d3.axisBottom` and `d3.axisLeft`, plus a manual legend of colored rectangles and text labels.
AI-generated descriptionMIT Licensed




Comments
Sign in to join the discussion.