🌍 Public
Cheap Tricks for Interaction
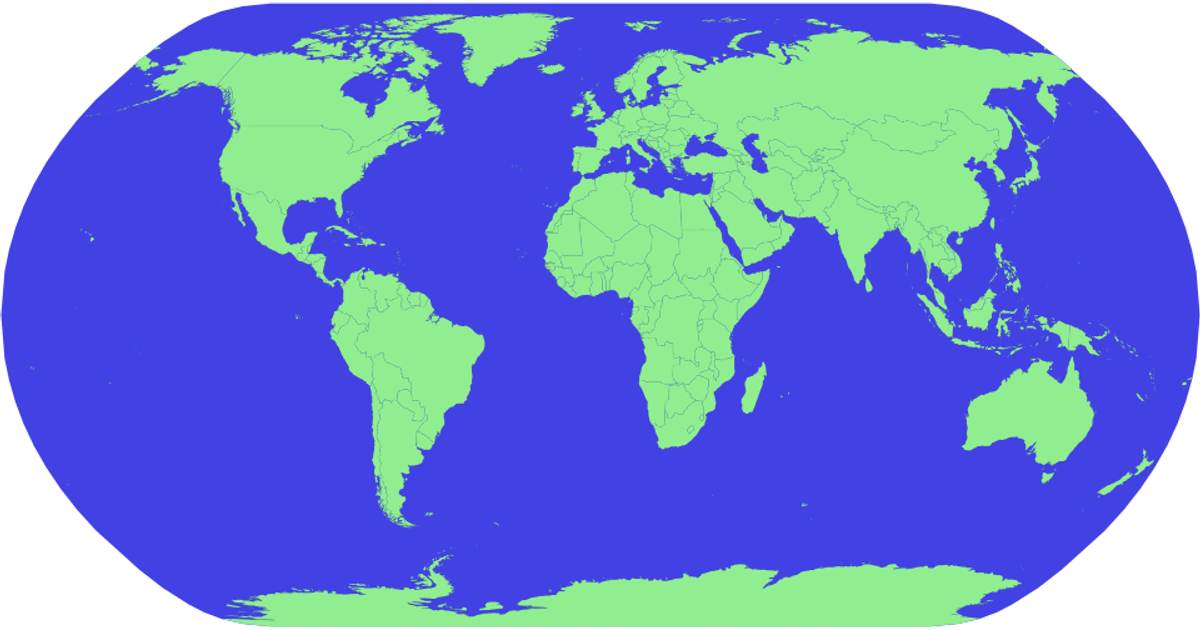
This example shows a global map of COVID-19 case totals, with country names and cumulative case counts displayed as tooltips on hover. The visualization uses a natural Earth projection via `d3.geoNaturalEarth1` and `d3.geoPath` to render sphere and country boundaries from TopoJSON data. Country data merges World Atlas TSV metadata with WHO CSV case numbers using lodash. Hovering highlights countries in red through CSS `:hover` rules. The implementation relies on D3 v5 selections, Promises, and TopoJSON's `feature` method, with a `title` element appended to each country path for tooltips.
AI-generated descriptionMIT Licensed



Comments
Sign in to join the discussion.