🌍 Public
Activity 7.1 Tutorial
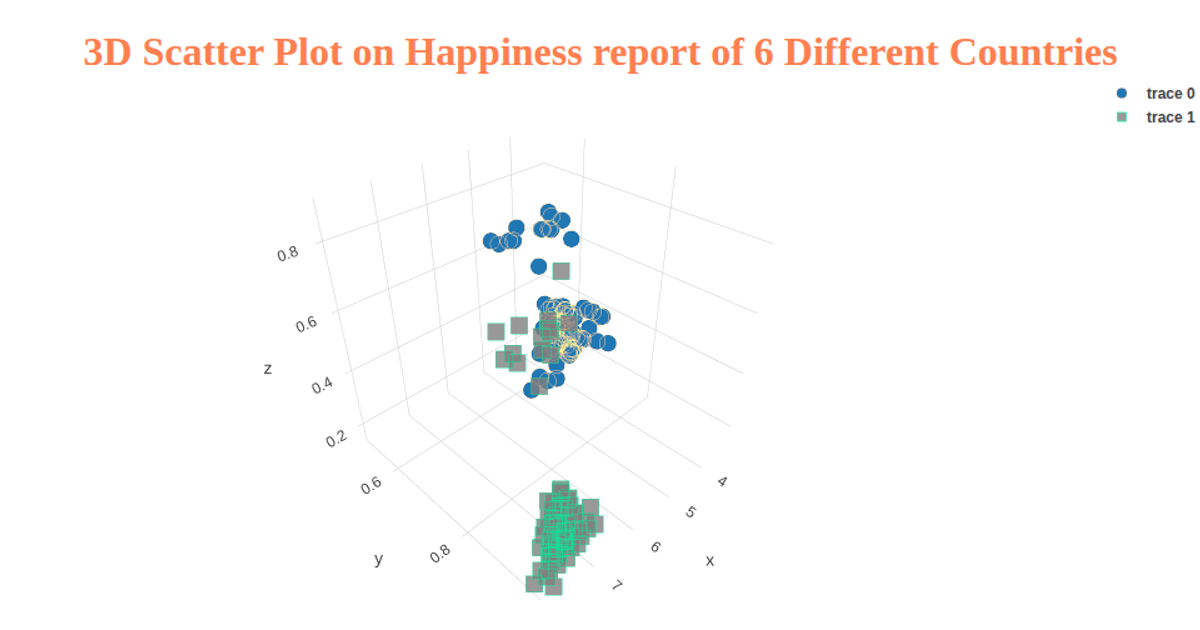
This animated scatter plot, driven by D3 v6, cycles through six World Happiness Report indicators from a 2019 CSV dataset. It visualizes the relationship between each indicator and the Happiness Score, updating the x-axis and labels every five seconds. The reusable `scatterPlot` function leverages D3's `scaleLinear`, `extent`, `axisLeft`, and `axisBottom` APIs to render SVG circles and axes, with the data sourced from a GitHub-hosted CSV.
AI-generated descriptionMIT Licensed



Comments
Sign in to join the discussion.