🌍 Public
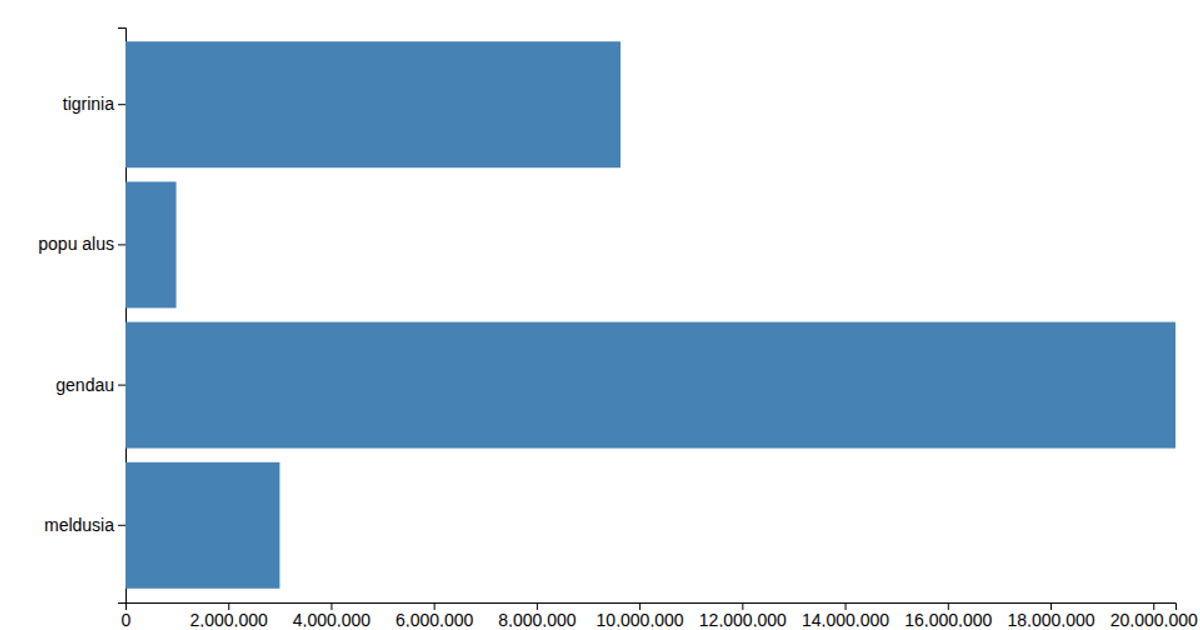
Bar chart
A horizontal bar chart displays population counts for five weeks (2019-W31 through 2019-W35) using green rectangles. The visualization uses D3 v5 APIs including `scaleLinear`, `scaleOrdinal`, `axisLeft`, and `axisBottom` to map the data and render axes. Data is loaded from a CSV file via `d3.csv` and rendered as SVG elements.
AI-generated descriptionMIT Licensed




Comments
Sign in to join the discussion.