🌍 Public
RAK
RRakshithaRao27
Last edited Mar 6, 2022
Created on Mar 6, 2022
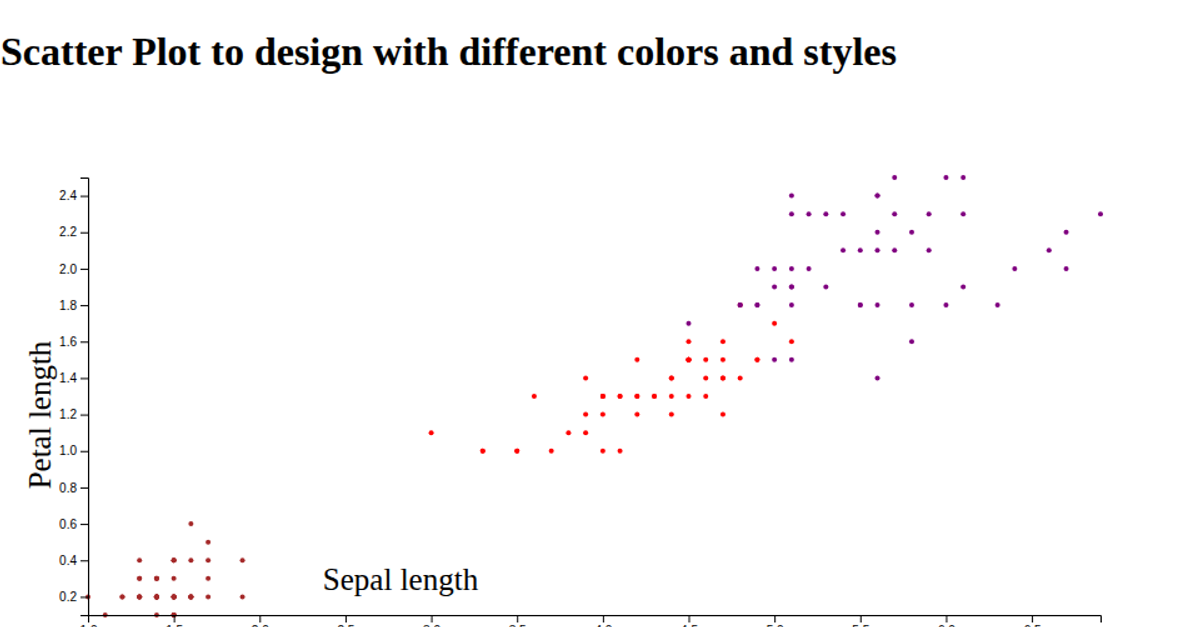
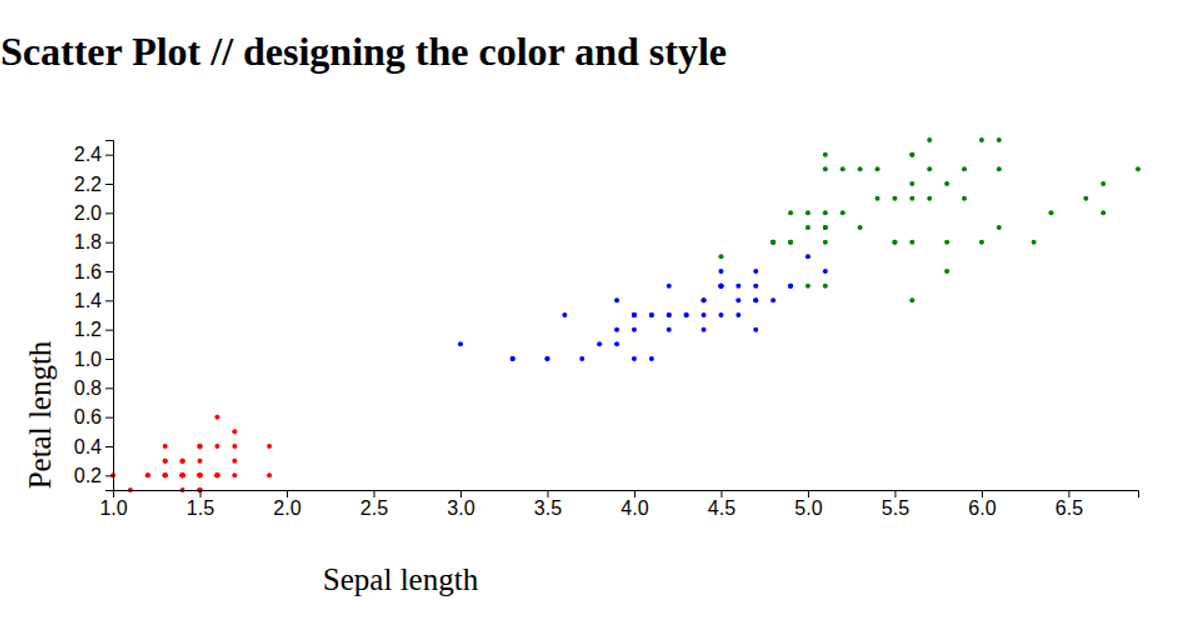
This D3 scatter plot visualizes the Iris Dataset, mapping petal length and width for each sample while encoding species through color. The circles are positioned using linear scales, with fixed radius but varied rectangular extents on horizontal and vertical axes. It uses `d3.csv` to load data, `scaleLinear` and `extent` for scales, and `axisLeft`/`axisBottom` for axes. The SVG rendering applies dynamic fill colors per species and displays the dataset’s sepal measurements through `rx` and `ry` attributes.
AI-generated descriptionA vanilla HTML implementation of a D3 scatter plot. Shows the Iris Dataset.
MIT Licensed




Comments
Sign in to join the discussion.