🌍 Public
Scatter plot interactions
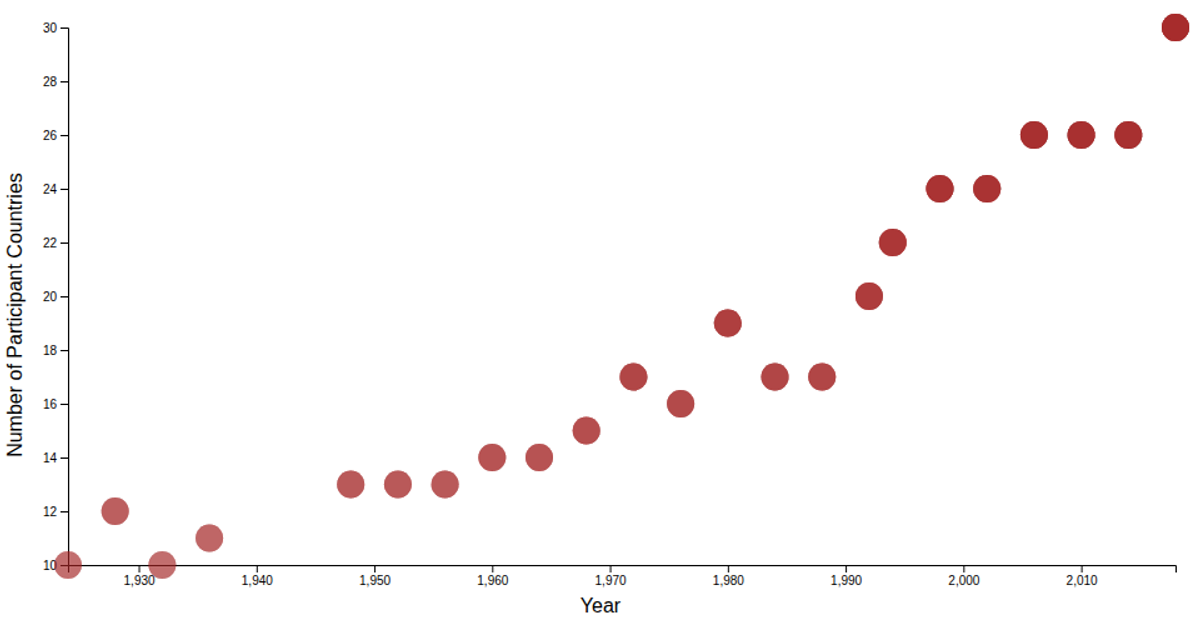
A scatter plot displays the number of participating countries in each Winter Olympic year, using data from a Kaggle dataset covering 1924–2018. Hovering over a point triggers a D3 transition that enlarges the circle radius, providing interactive feedback. The visualization is built with d3-scale for axes, d3-axis for ticks, and custom axis label helpers, all rendered as SVG elements with mouseover and mouseout event handlers.
AI-generated descriptionDataset - https://www.kaggle.com/datasets/ramontanoeiro/winter-olympic-medals-1924-2018
Outer circle around the data point on hover
MIT Licensed






Comments
Sign in to join the discussion.