🌍 Public
GraphLayout with Interactive Filtering
EEdward-Elric233
Last edited Dec 4, 2020
Created on Oct 19, 2020
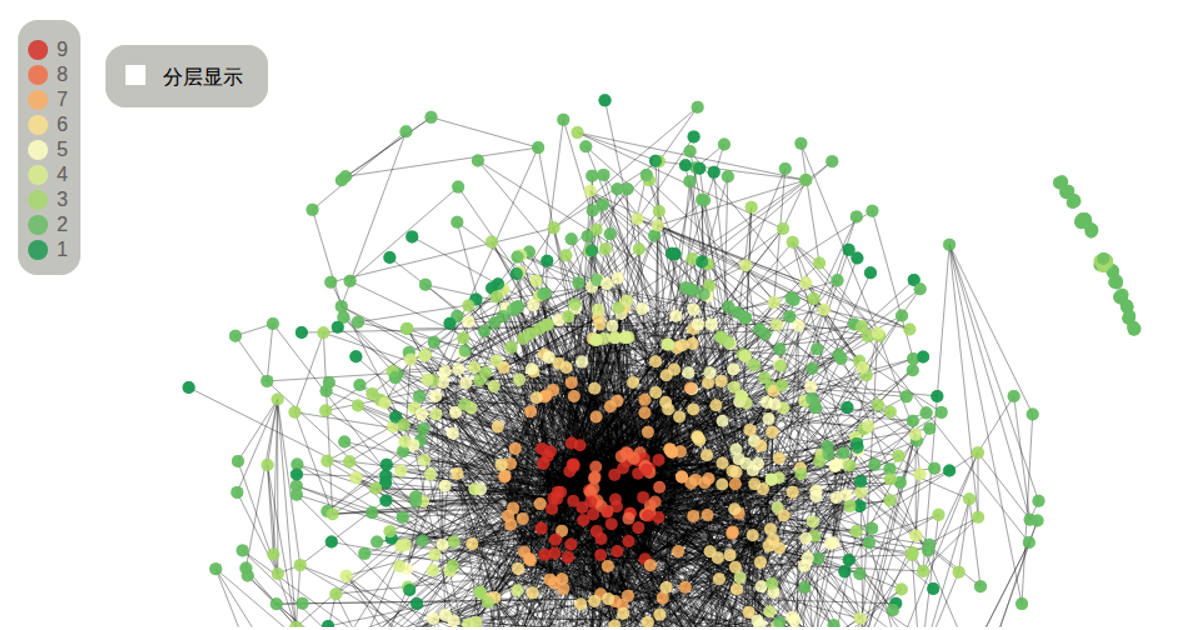
This interactive graph layout visualization displays a network of domains, IP addresses, certificates, and ASN relationships. Users can filter edges by clicking on horizontal bar charts in a scrollable sidebar, which highlights or dims corresponding links in the force-directed graph. The visualization uses d3.forceSimulation for layout, with interactive filtering controlled through custom SVG components and a drag-based slider that adjusts edge strengths. Node and edge colors are mapped via d3.scaleOrdinal based on hierarchical categories.
AI-generated descriptionMIT Licensed


Comments
Sign in to join the discussion.