🌍 Public
Fork of Fork of Fork of Cat smiley
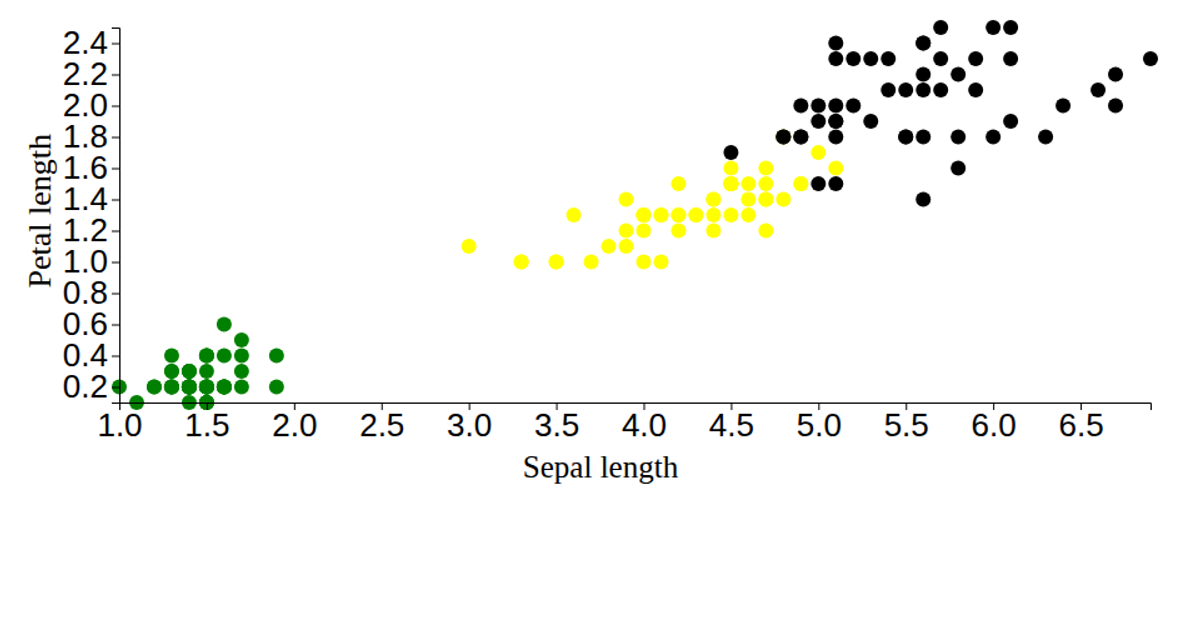
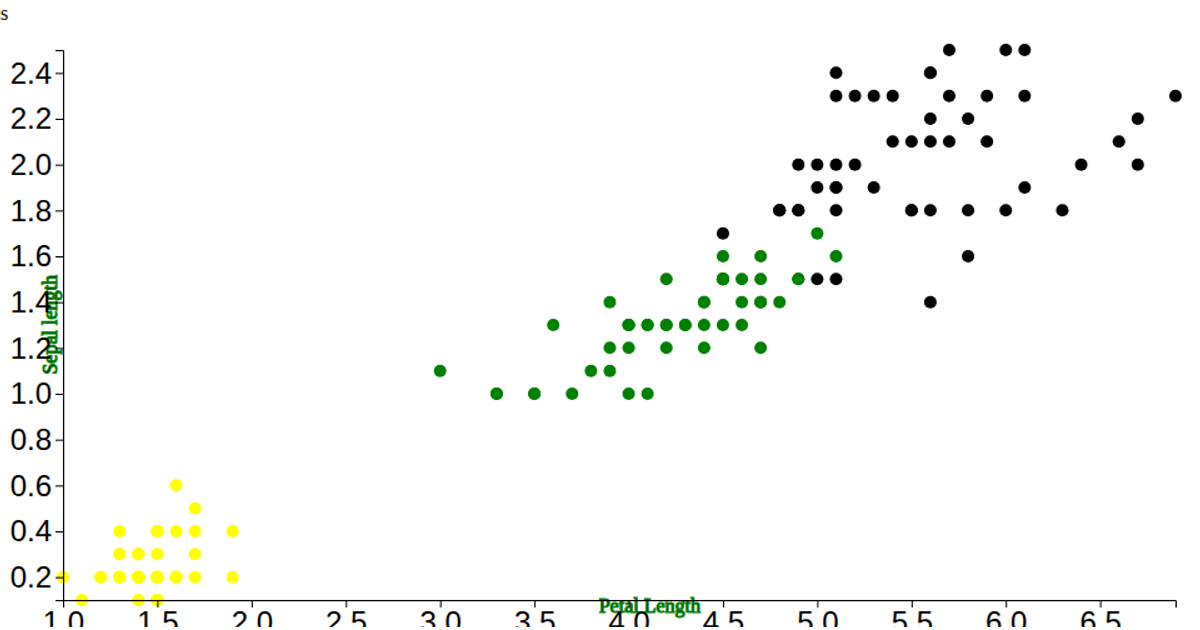
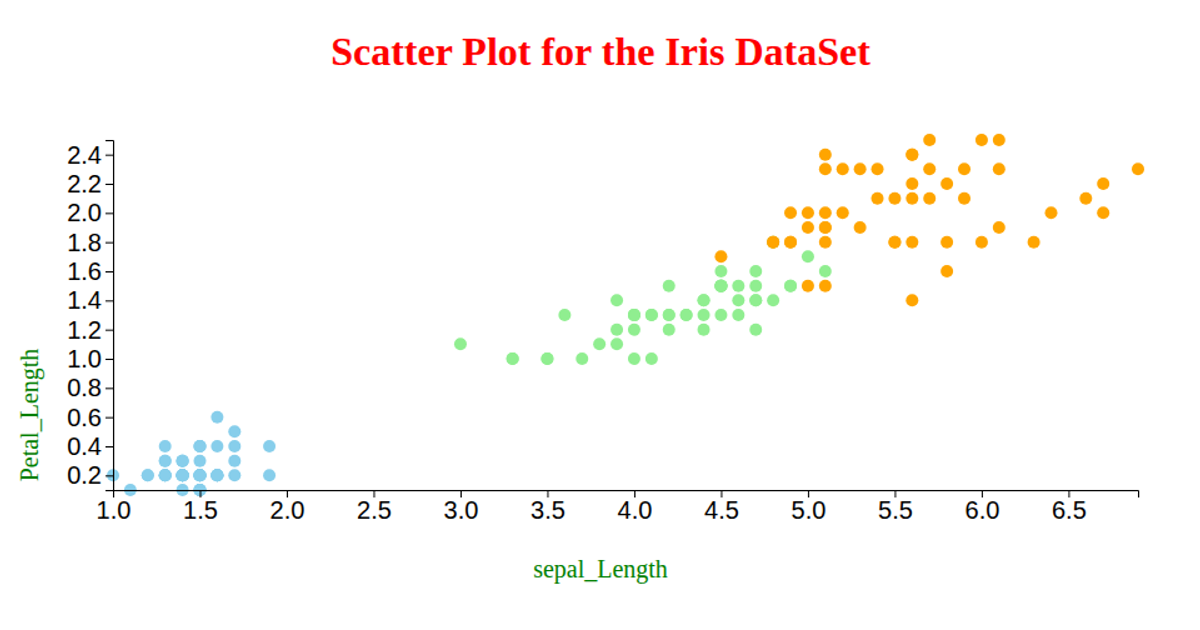
This example displays a scatter plot of the Iris dataset, plotting petal length against sepal length with points colored by species: orange for setosa, blue for versicolor, and green for virginica. The visualization uses d3.csv to load the data and d3.scaleLinear, d3.extent, d3.axisLeft, and d3.axisBottom to map measurements and render the axes with SVG. Circle elements represent individual observations, while axis labels indicate the measured dimensions in centimeters.
AI-generated descriptionA whole smiley face
MIT Licensed




Comments
Sign in to join the discussion.