🌍 Public
Vega-Lite API Template
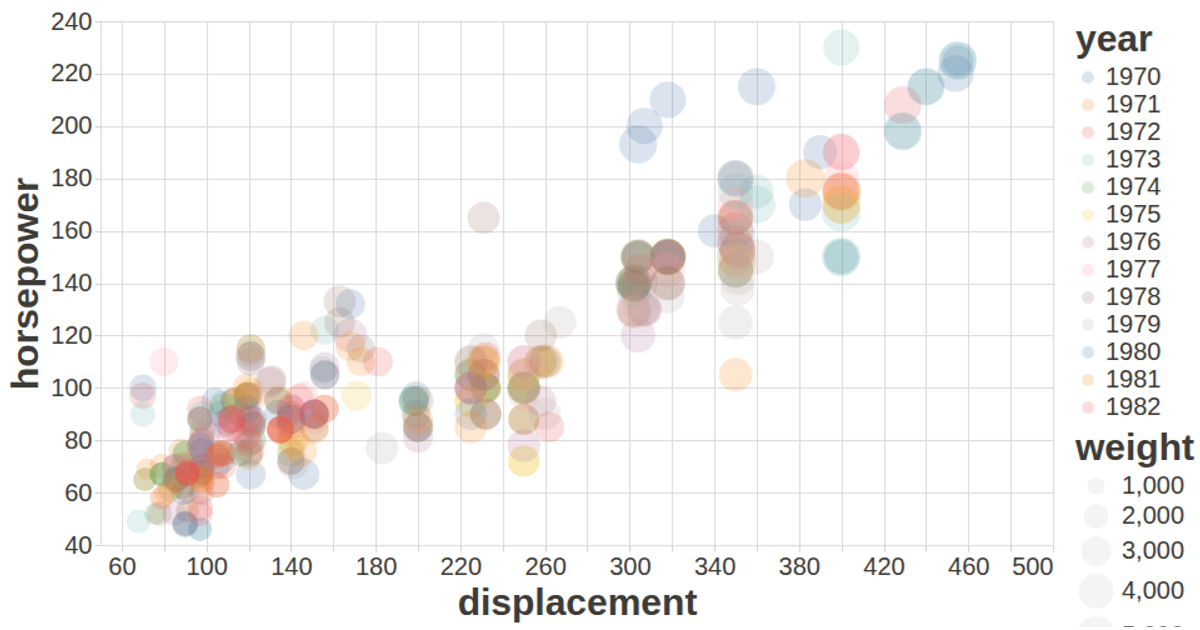
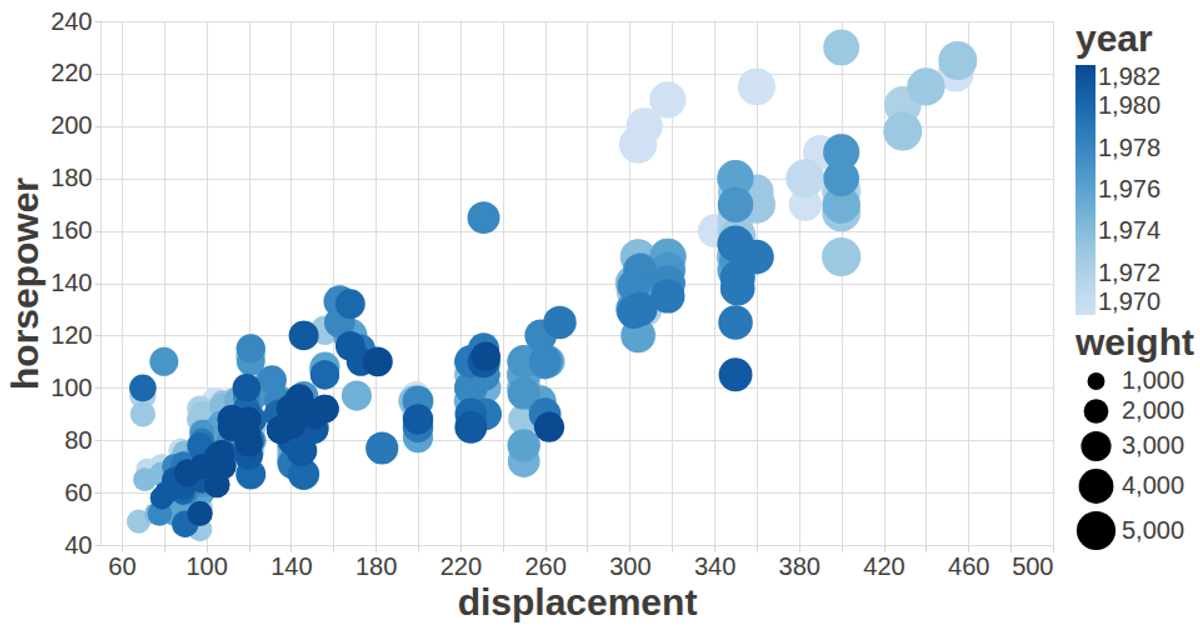
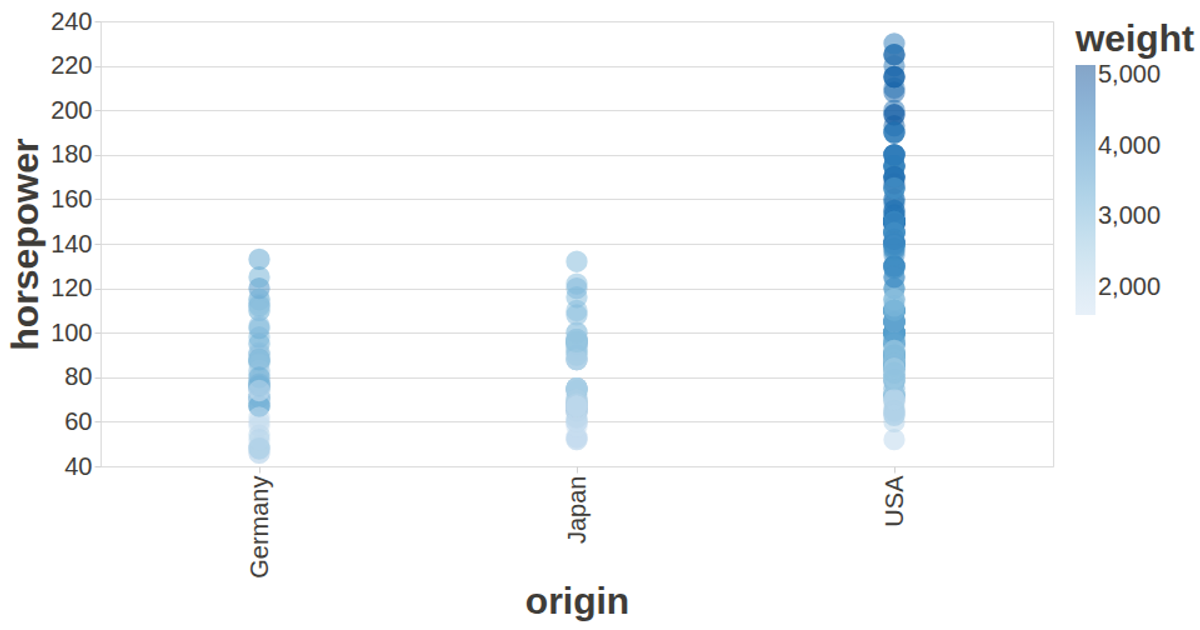
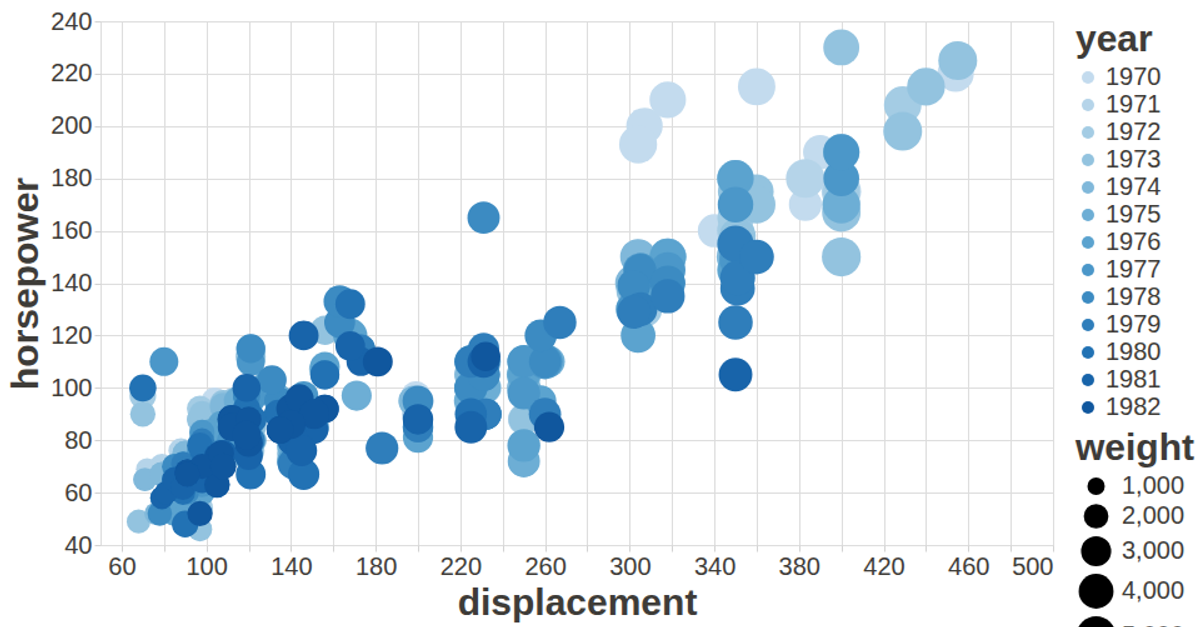
This example visualizes the relationship between engine displacement, horsepower, weight, and model year for the classic Auto MPG dataset. A scatterplot maps displacement to the x-axis and horsepower to the y-axis, with circle size encoding weight and color encoding year via Vega-Lite’s quantitative field mappings. The code uses the Vega-Lite API (`vl.markCircle`, `vl.x().fieldQ()`) to build the specification, registers it through `vega-lite-api` with vega-tooltip for interactive hover details, and loads CSV data with `d3.csv`. Styling is customized through a config object.
AI-generated descriptionA visualization constructed using the vega-lite-api.
MIT Licensed




Comments
Sign in to join the discussion.