🌍 Public
Hello VX
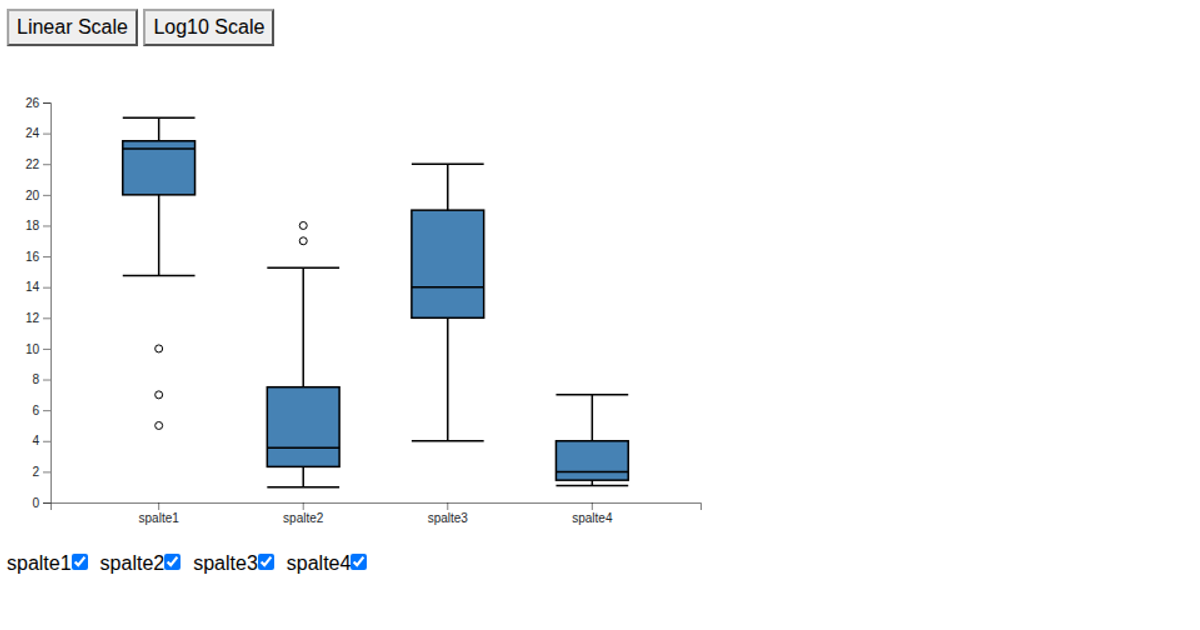
This example shows a gradient-background chart combining violin plots with overlaid box plots for five groups of generated statistical data. The visualization uses `@vx/stats` components (`ViolinPlot`, `BoxPlot`) with scales from `@vx/scale`, and renders as SVG. Hovering over box plot elements triggers tooltips via `@vx/tooltip`, revealing min, max, or full quartile statistics. Data comes from `@vx/mock-data`’s `genStats` function, styled with `@vx/gradient` and `PatternLines`.
AI-generated descriptionReact starter code.
MIT Licensed




Comments
Sign in to join the discussion.