🌍 Public
Untitled
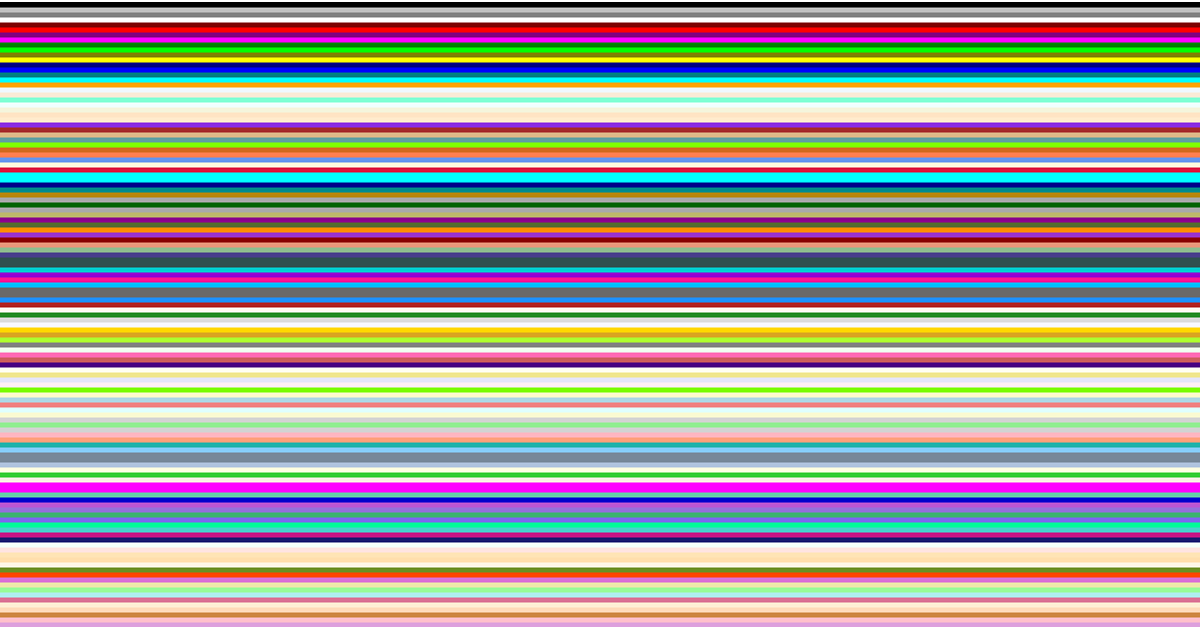
This example visualizes the 148 CSS named colors as points positioned by their RGB values, with the color of each point matching the named color it represents. Using D3’s `d3.forceSimulation`, the points are arranged in a loose cluster, while a label appears on hover to identify the color’s name. The data is parsed from a CSV file listing color names and hex codes, with the background and interactions powered by D3 selections and event handlers. The layout is computed entirely in the browser, offering a playful, exploratory map of the color space.
AI-generated descriptionA program that loads and parses some CSV data: CSS Named Colors.
MIT Licensed






Comments
Sign in to join the discussion.