🌍 Public
Fork of Iris Parallel Coordinate Plot
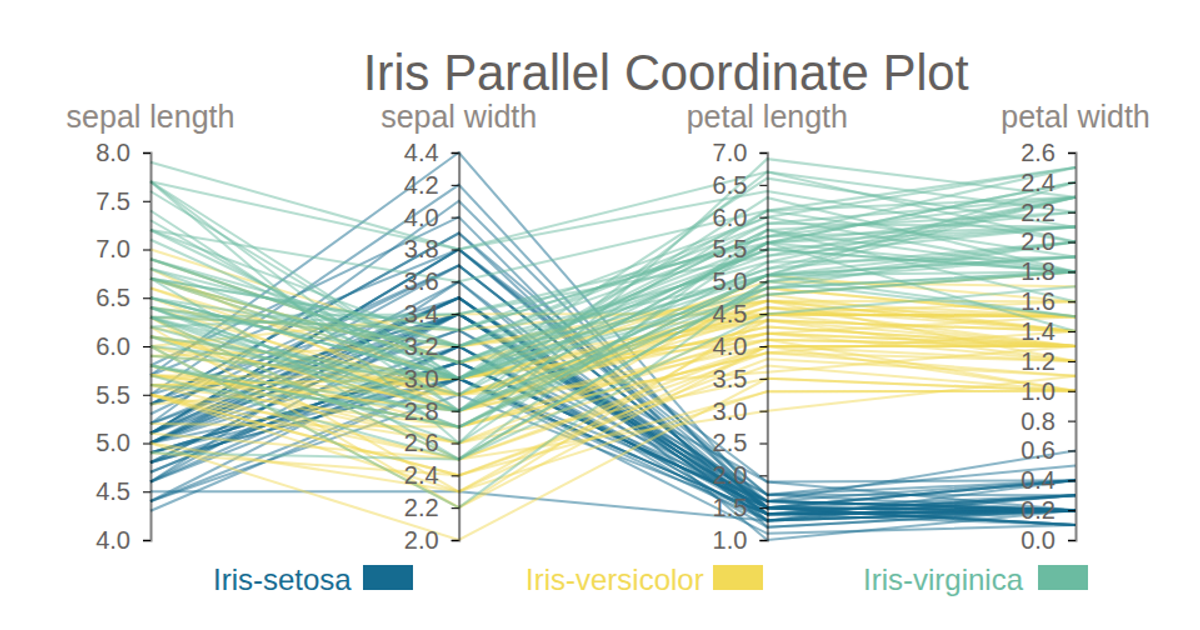
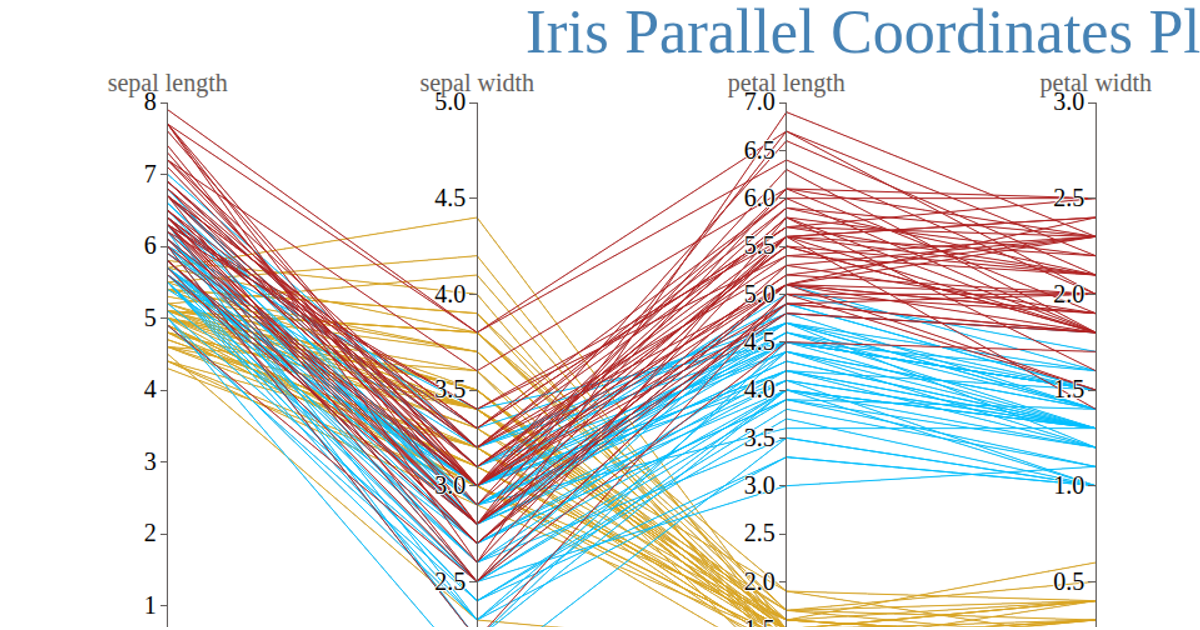
A parallel coordinate plot visualizes exam data from a CSV file, showing seven numeric and categorical attributes per student, with lines colored by pass/fail status. Users can drag any axis vertically to reposition it, which reorders the columns and dynamically redraws the polylines using d3.line. The axes use d3.scalePoint and d3.scaleLinear with d3.axisLeft, while drag behavior is implemented via d3.drag, and reordering transitions animate the updates over 300 milliseconds. The SVG rendering includes labeled axes, a title, and a color legend.
AI-generated descriptionMIT Licensed





Comments
Sign in to join the discussion.