🌍 Public
Fork of Fork of Vega-Lite API Template
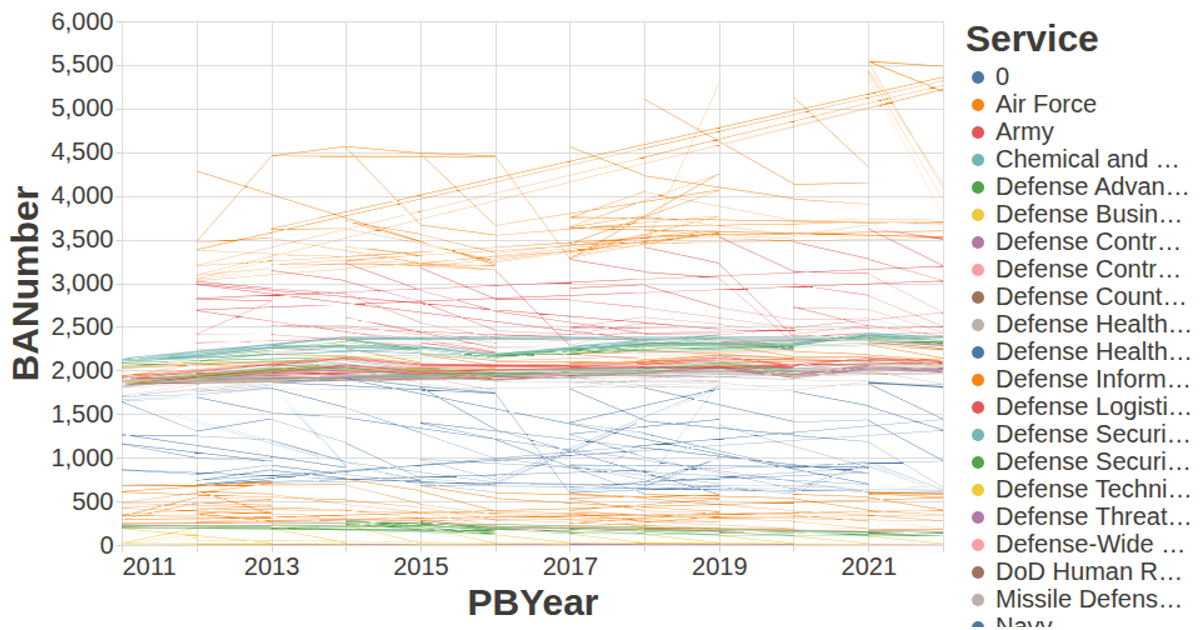
This example visualizes yearly costs by bar height, with tooltips displaying the associated account code. The visualization is built with the Vega-Lite API, using `vl.markBar()`, `vl.x()`, and `vl.y()` to encode the data fields. It loads CSV data from a remote URL via `d3.csv`, then renders the chart to a canvas using Vega and Vega-Lite’s rendering engine. The `config.js` file customizes axis and label styling for improved readability, while the `vega-tooltip` handler enables interactive hover details.
AI-generated descriptionA visualization constructed using the vega-lite-api.
MIT Licensed



Comments
Sign in to join the discussion.