🌍 Public
Making a Map with D3!
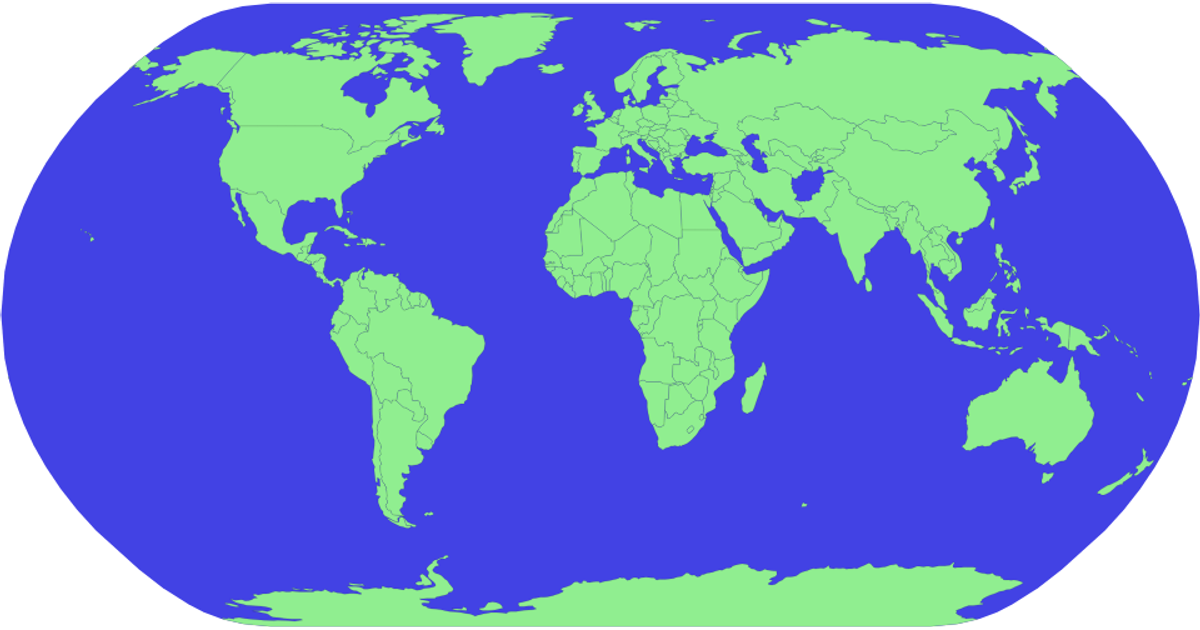
This visualization displays a world map in a natural Earth projection, with countries filled in pale green and the sphere rendered in cornflower blue. The code uses D3 v5’s `geoPath` and `geoNaturalEarth1` projections, along with the topojson `feature` function, to convert GeoJSON country boundaries into SVG paths. Country data comes from the world-atlas 110m dataset, while the map’s ocean and landmasses are drawn as separate SVG paths.
AI-generated descriptionA bare minimum HTML page.
See also React Starter.
MIT Licensed



Comments
Sign in to join the discussion.