🌍 Public
Fork of Interactive Color Legend
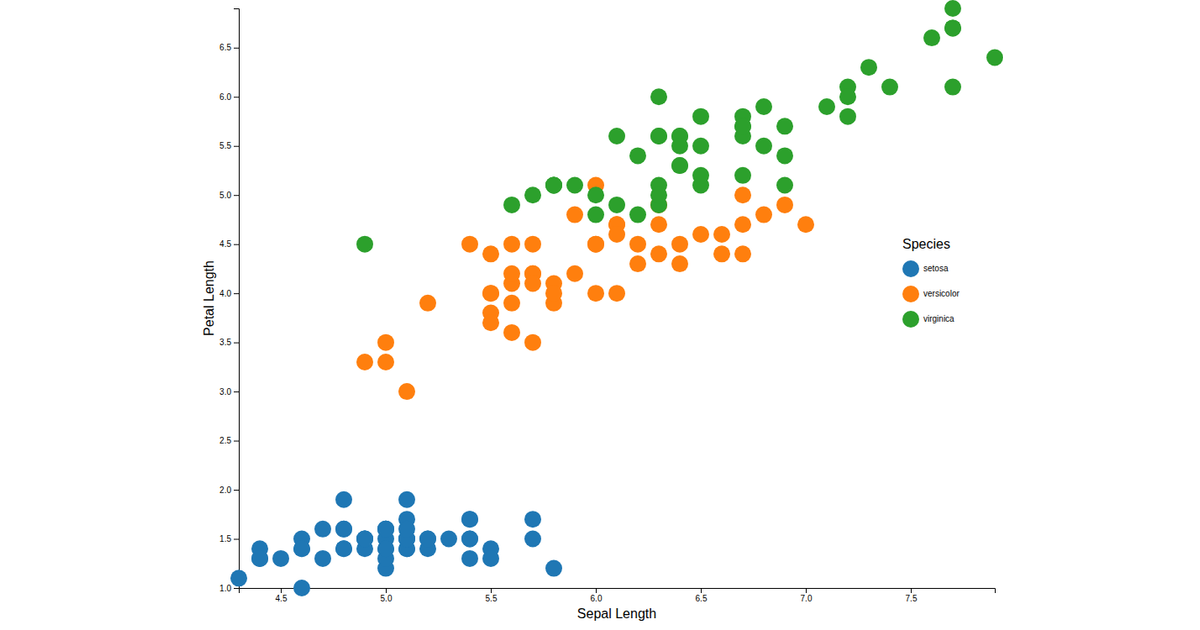
This interactive scatter plot visualizes the Iris Dataset, displaying sepal length versus petal length with points colored by species using d3.scaleOrdinal and schemeCategory10. Hovering over the color legend highlights marks matching that species while dimming others, managed through a hoveredValue state and mouseover events. The visualization uses d3-selection joins (selection.join) for efficient SVG updates, with axes and labels rendered via custom functions built on d3.axisLeft, d3.axisBottom, and linear scales.
AI-generated descriptionA scatter plot of the Iris Dataset with a color legend.
Hover on the color legend to highlight the marks that match!
See also:
MIT Licensed




Comments
Sign in to join the discussion.