🌍 Public
Avocados Scatter Plot With Menus
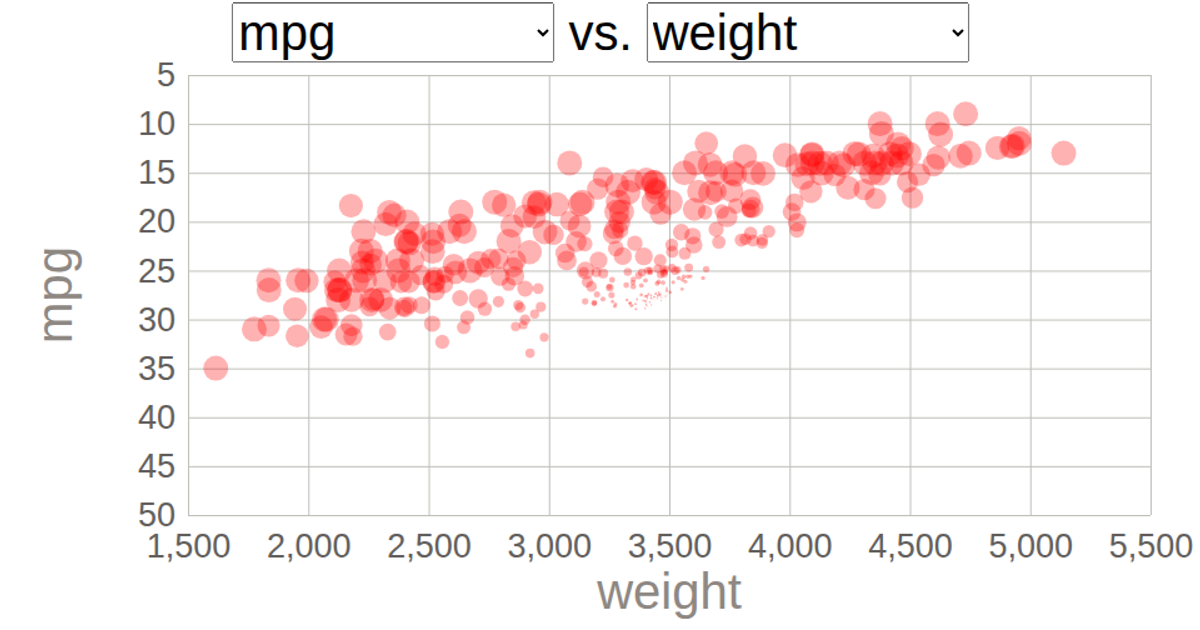
This interactive scatter plot visualizes avocado pricing data from the Hass Avocado dataset on Kaggle. Two dropdown menus allow users to select which variables to plot on the x- and y-axes, dynamically updating the visualization. The plot uses D3.js v5's `scaleLinear` for axes and `axisLeft`/`axisBottom` for tick marks, with circles animating via `transition().duration(1000).delay()`. The CSV data is loaded from a remote URL, and the scatter plot is rendered as SVG with axes labels and a grid of tick lines.
AI-generated descriptionThis scatter plot shows data about Avocados, from Hass Avocado.
MIT Licensed






Comments
Sign in to join the discussion.