🌍 Public
Assignment 2
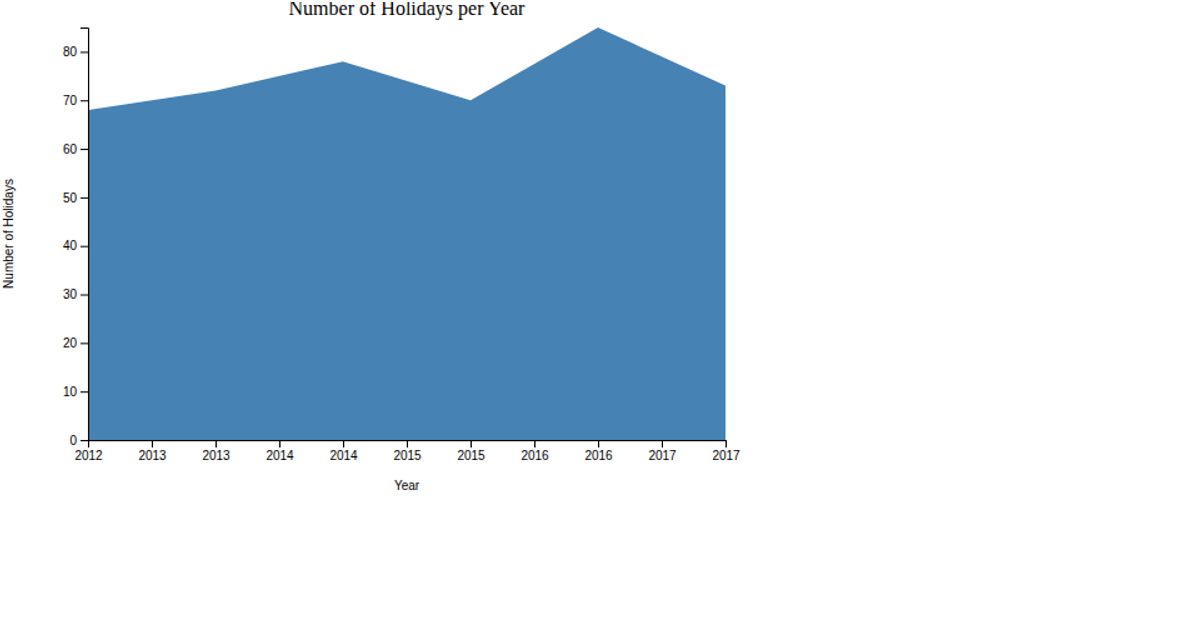
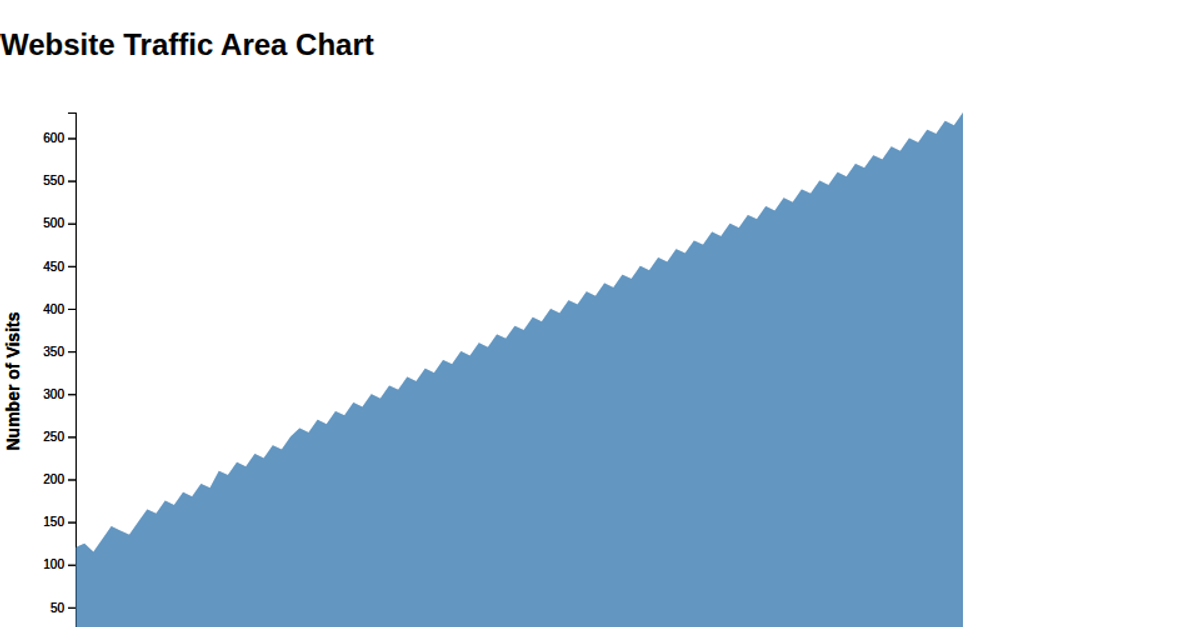
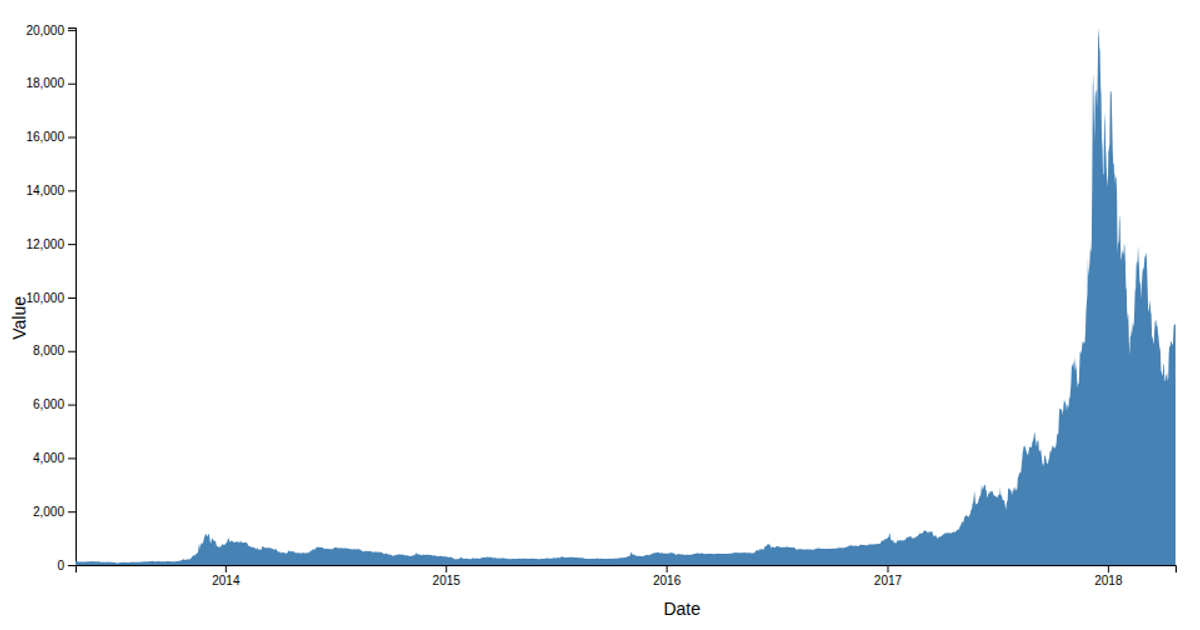
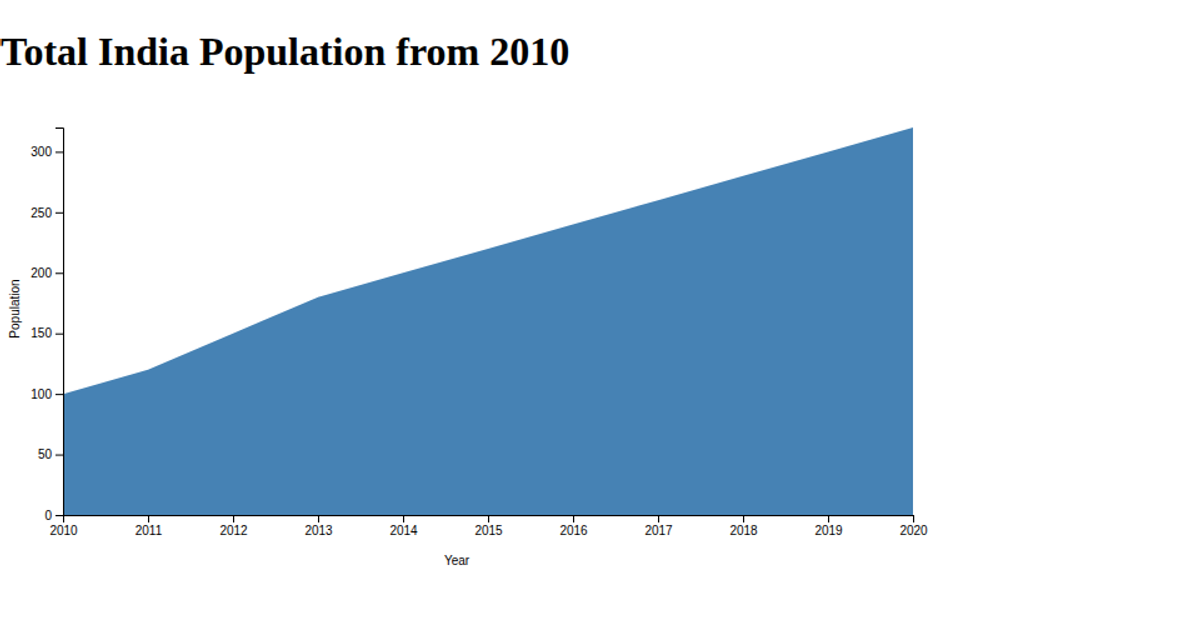
This area chart visualizes hospital outpatient visits from 2000 to 2024, with the x-axis mapping years and the y-axis showing visit counts. The chart uses a steelblue filled area path, created with the d3.area() API, and scales via d3.scaleLinear. Axes are generated with d3.axisBottom and d3.axisLeft, and labels are added for clarity. Data is loaded from a CSV file using d3.csv, and the SVG renders with a title.
AI-generated descriptionMIT Licensed




Comments
Sign in to join the discussion.