🌍 Public
Fork of Bowl of Fruit
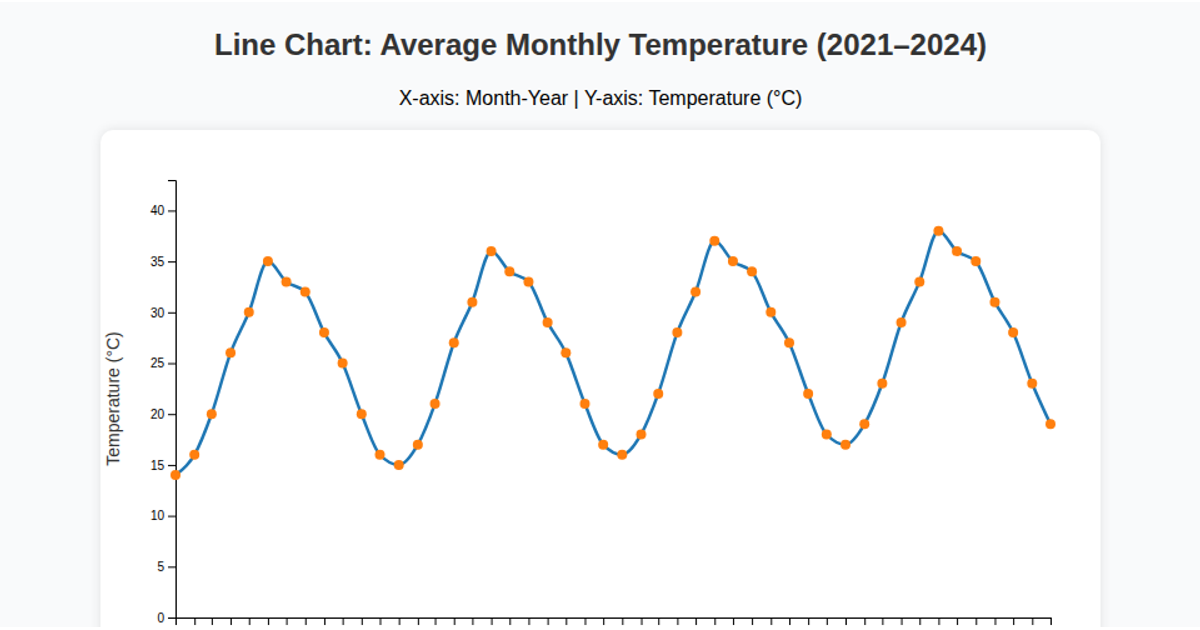
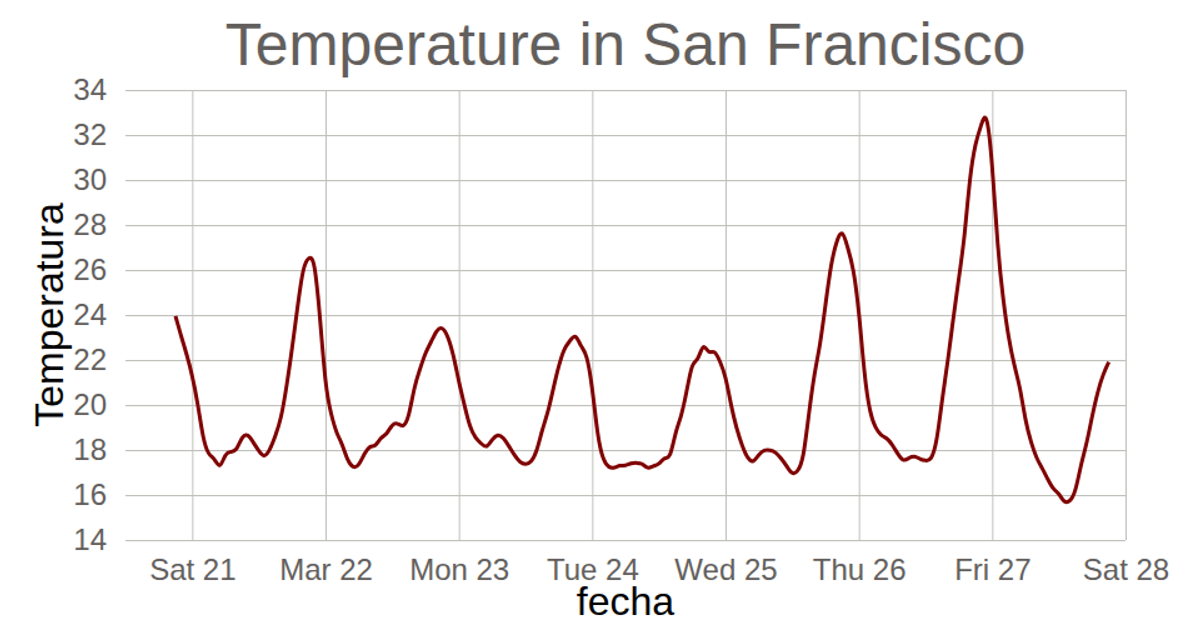
A minimal line chart displays temperature readings from the `data.csv` file, showing a time series of temperature fluctuations across several days. The visualization uses a linear scale to map the data values to pixel positions along the x-axis, with an axis generated by `d3.axisBottom`. The SVG is created and appended using D3's selection methods, and the chart is rendered without any additional styling or tooltips.
AI-generated descriptionMIT Licensed



Comments
Sign in to join the discussion.