🌍 Public
Answer1
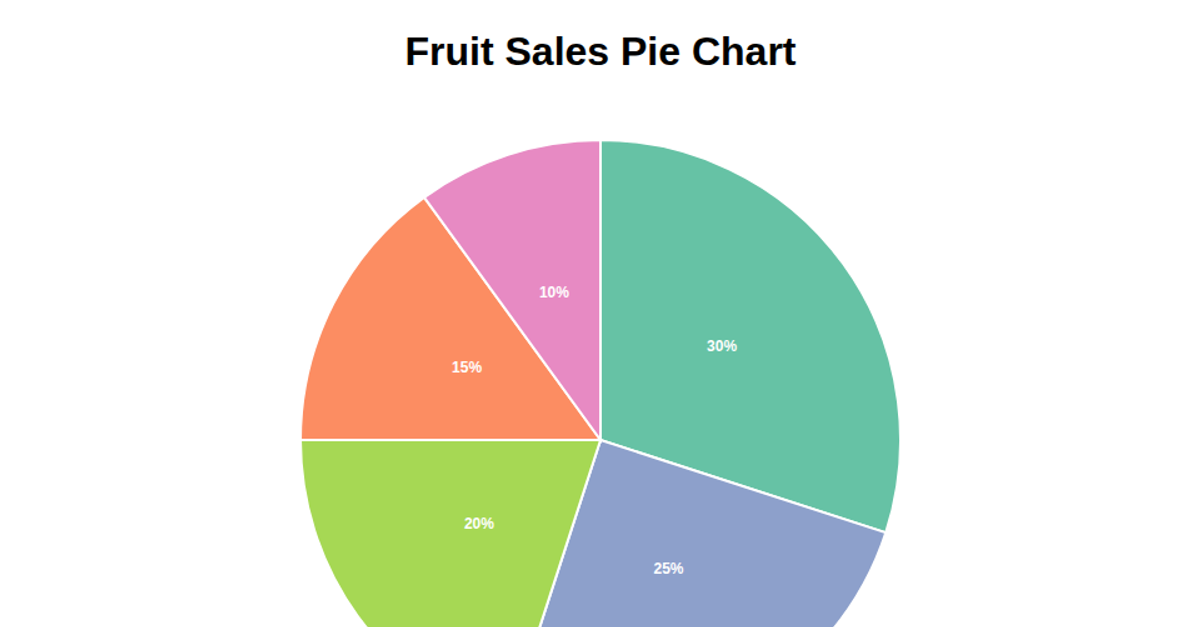
This pie chart shows the distribution of bike-share stations across municipalities, with slice labels and a color-coded legend. Built with D3 v6, it loads CSV data from a GitHub-hosted hubway_stations file, uses `d3.rollups` to count stations per municipality, and applies `d3.pie()` and `d3.arc()` to generate the SVG paths. A `d3.scaleOrdinal` with `d3.schemeCategory10` encodes categories, while labels are positioned using `arc.centroid()`. The legend is appended separately, and all shapes render as SVG elements in a fixed-width layout.
AI-generated descriptionMIT Licensed





Comments
Sign in to join the discussion.