🌍 Public
Fork of Map with Selectable Countries
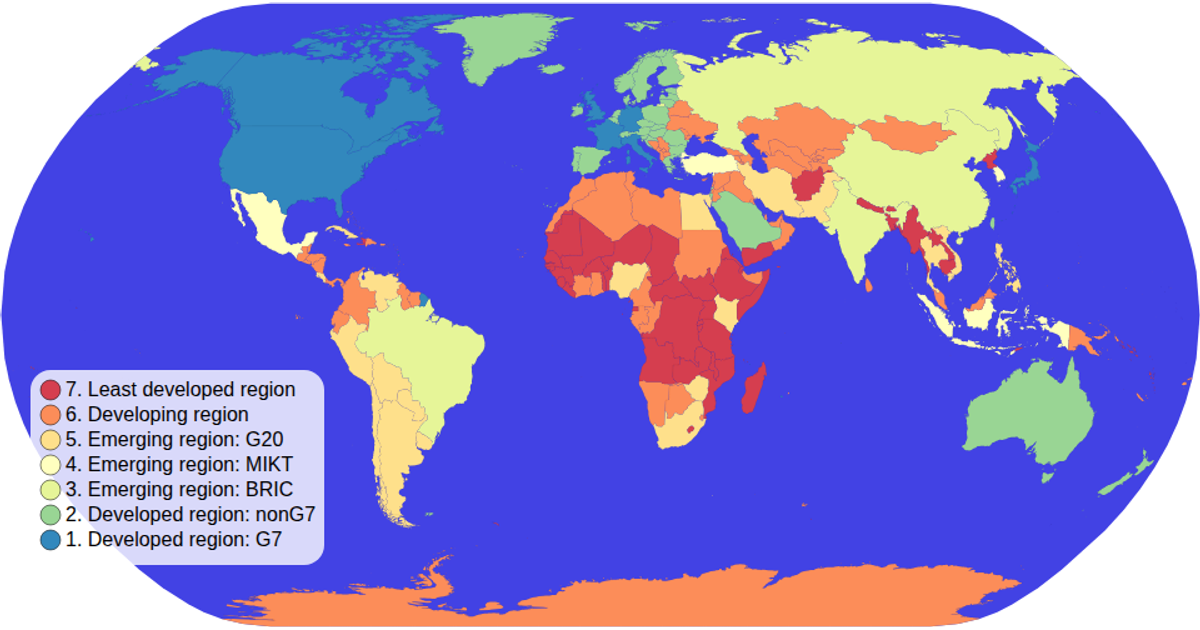
This interactive choropleth map displays countries colored by economic group, with a legend that filters the map's color encoding. Clicking a country selects it, dimming all others, while a click on the legend resets the selection. The visualization uses a natural Earth projection via d3.geoNaturalEarth1 and renders geographic paths with d3.geoPath. Data is loaded from a world-atlas TopoJSON with TSV metadata, and the ordinal color scheme comes from d3.scaleOrdinal and d3.schemeSpectral. Interactivity is handled with D3's selection API and event listeners.
AI-generated descriptionMIT Licensed



Comments
Sign in to join the discussion.