🌍 Public
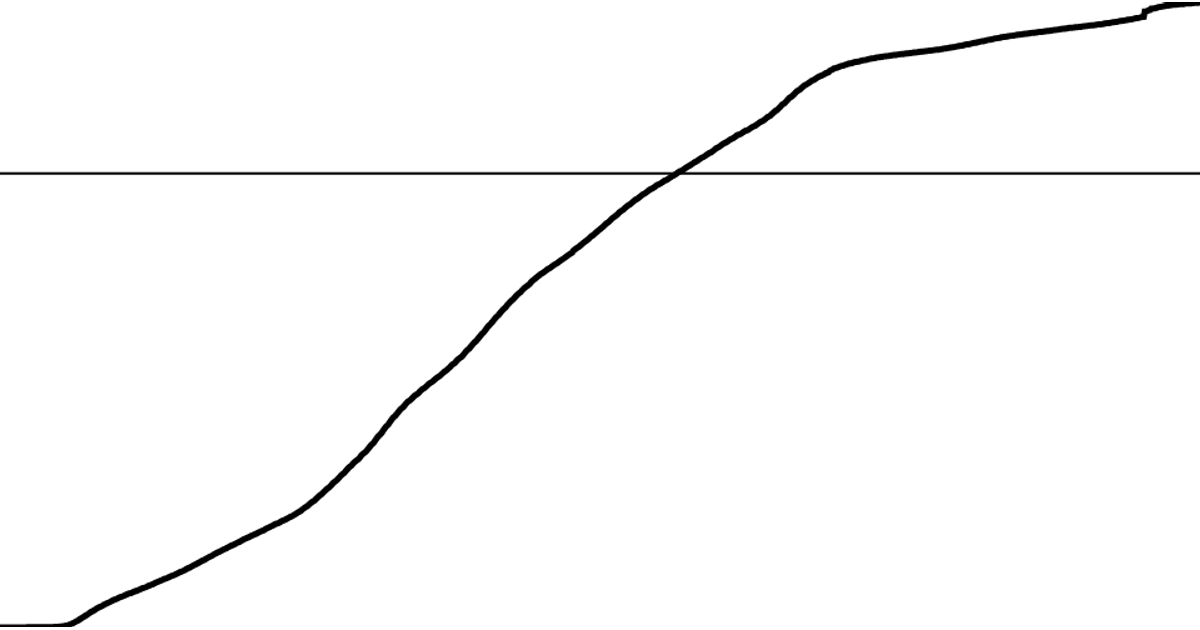
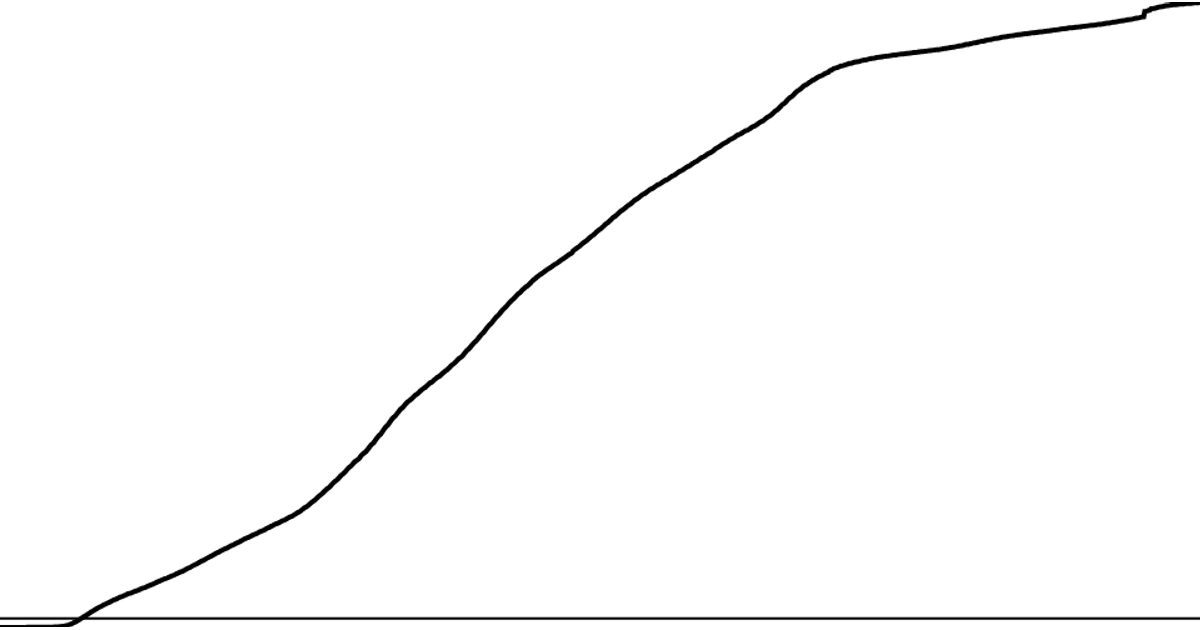
Coronavirus Line Chart With 5,000,000 Marker Line
A line chart displays worldwide cumulative COVID-19 deaths over time, with a horizontal marker line highlighting the 5,000,000 death milestone. The chart uses a React component with D3’s `scaleTime`, `scaleLinear`, and `line` generator to map dates and death totals to SVG coordinates. The marker line is positioned using `yScale(5000000)`. Data comes from the CSSEGISandData COVID-19 time series CSV, aggregated by summing daily global deaths. The SVG renders the trend as a black stroke and the threshold as a thinner line, filling the browser viewport.
AI-generated descriptionMIT Licensed




Comments
Sign in to join the discussion.