🌍 Public
Org Chart
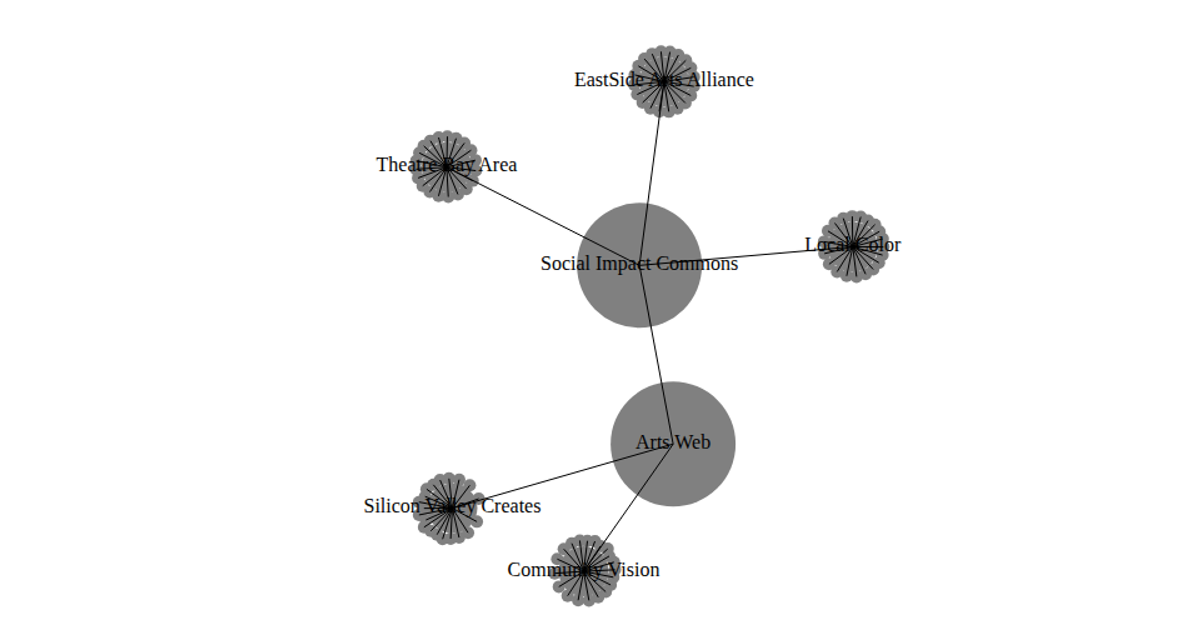
This example shows an organization chart as a force-directed network. It displays rectangular nodes for different systems (such as “CCK.L2.PCS.IntHub”) and grey lines for their reporting relationships. The visualization uses d3.forceSimulation to compute the layout, with forces like d3.forceManyBody, d3.forceLink, and d3.forceCenter. The SVG is rendered using d3.select and d3.append, with node color determined by a numeric code: green for level 5, red for level 2, and blue for level 3.
AI-generated descriptionMIT Licensed



Comments
Sign in to join the discussion.