🌍 Public
Making a World Population Bar Chart
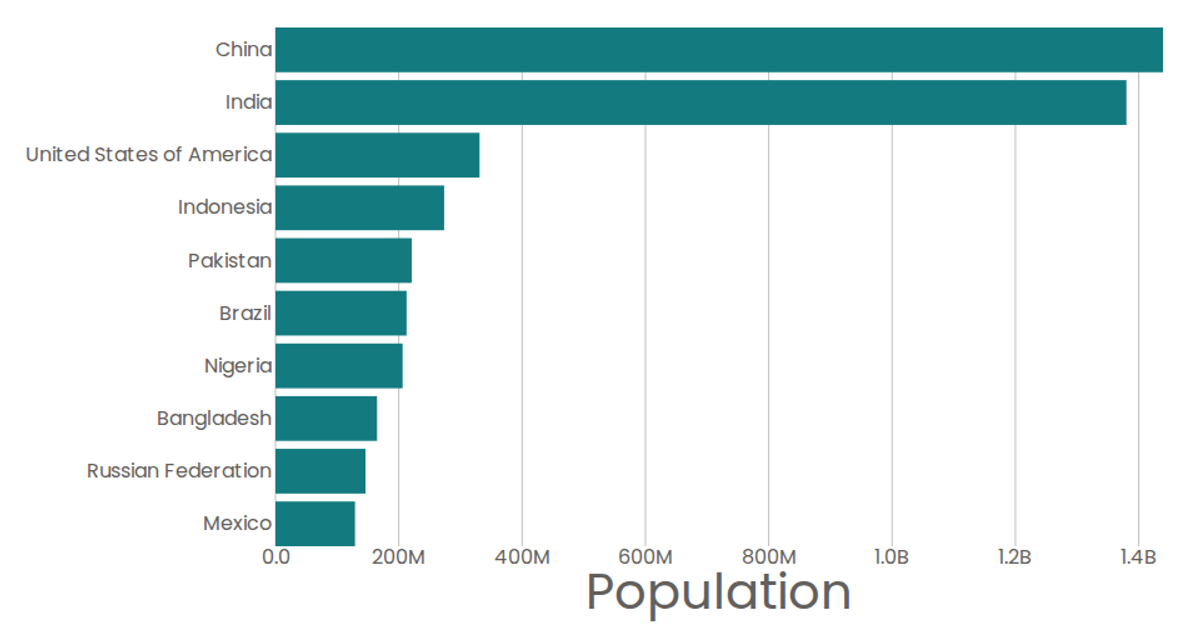
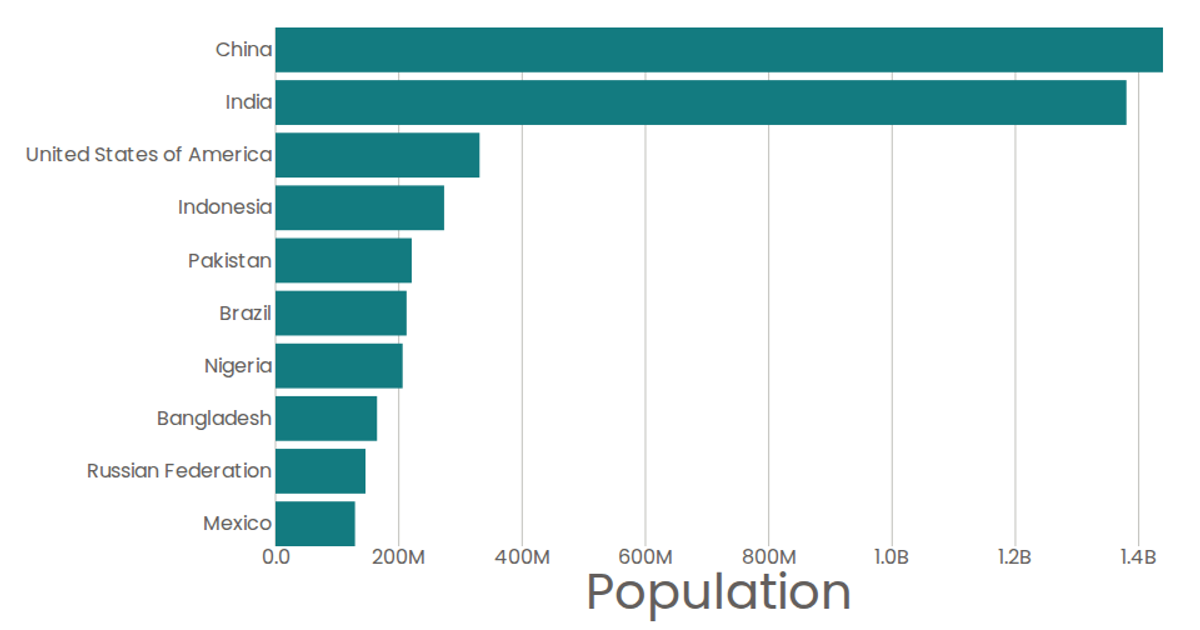
This bar chart displays the top 10 most populous countries for 2020, using horizontal bars ordered by population with a labeled x-axis. The visualization is built with React and D3 v5, using `scaleBand` for the categorical y-axis, `scaleLinear` for the numeric x-axis, and SVG `<rect>` elements for the bars. Population values are fetched from a CSV file via `d3.csv` and formatted with `d3.format`. Tooltips show exact values using the SVG `<title>` element.
AI-generated descriptionMaking a World Population Bar Chart using React and D3.
MIT Licensed





Comments
Sign in to join the discussion.