Submarine Cables AirOcean Projection
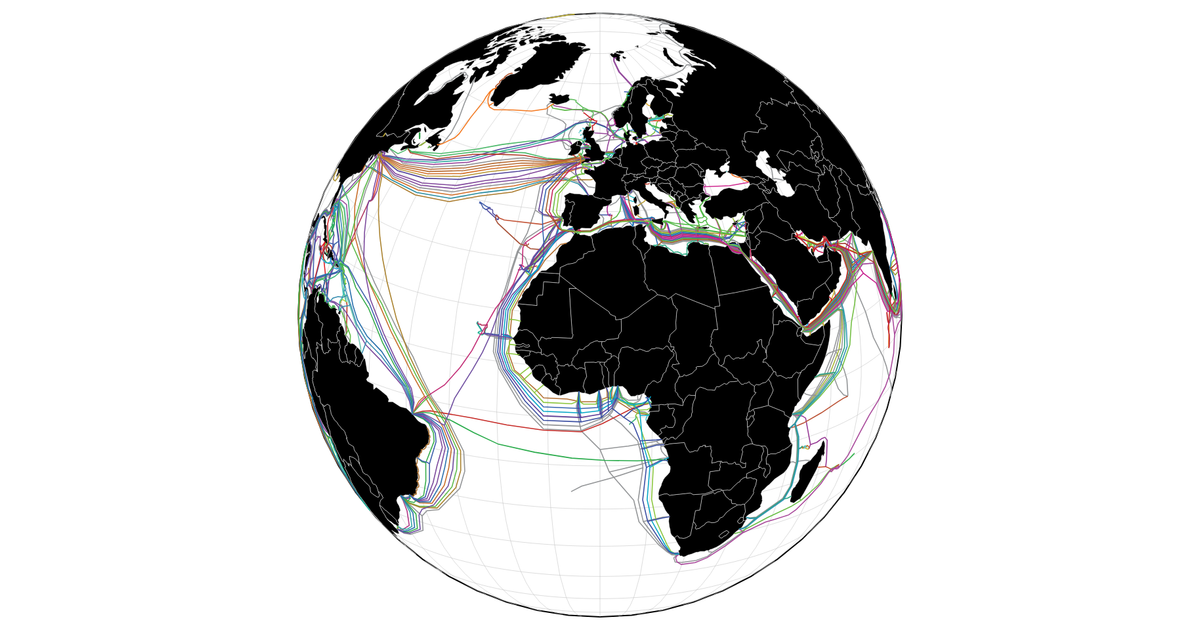
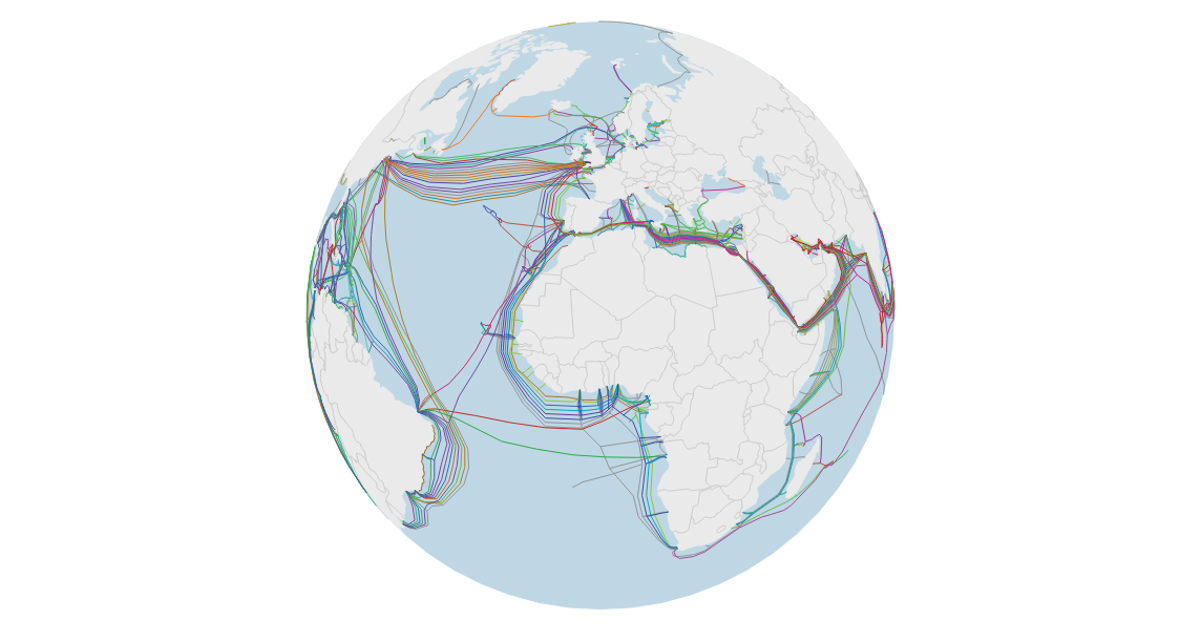
This example visualizes submarine cables laid across a map of the world using the air-ocean projection from `d3-geo-polygon`. It displays country boundaries, a graticule, and a sphere outline, with cables colored by their properties. Drag and zoom interactions are implemented via D3’s `drag` and `zoom` behaviors, adjusting the projection’s rotation and scale. The map uses `geoPath` to render features from TopoJSON world atlas data and cable data from a TeleGeography GitHub fork, all within an SVG generated by D3’s `select` and `join` methods.
AI-generated descriptionAn attempt at using a cool projection. This didn't work well for the visualization.
But it's a first step! Here's the video of unlocking the
d3.airOcean projection:
Data from TeleGeography's Submarine Cable Map (old GitHub fork). Note that this data is not up to date. For up to date data, see telegeography.com and submarinecablemap.com.



Comments
Sign in to join the discussion.