🌍 Public
Project in progress - Week 1
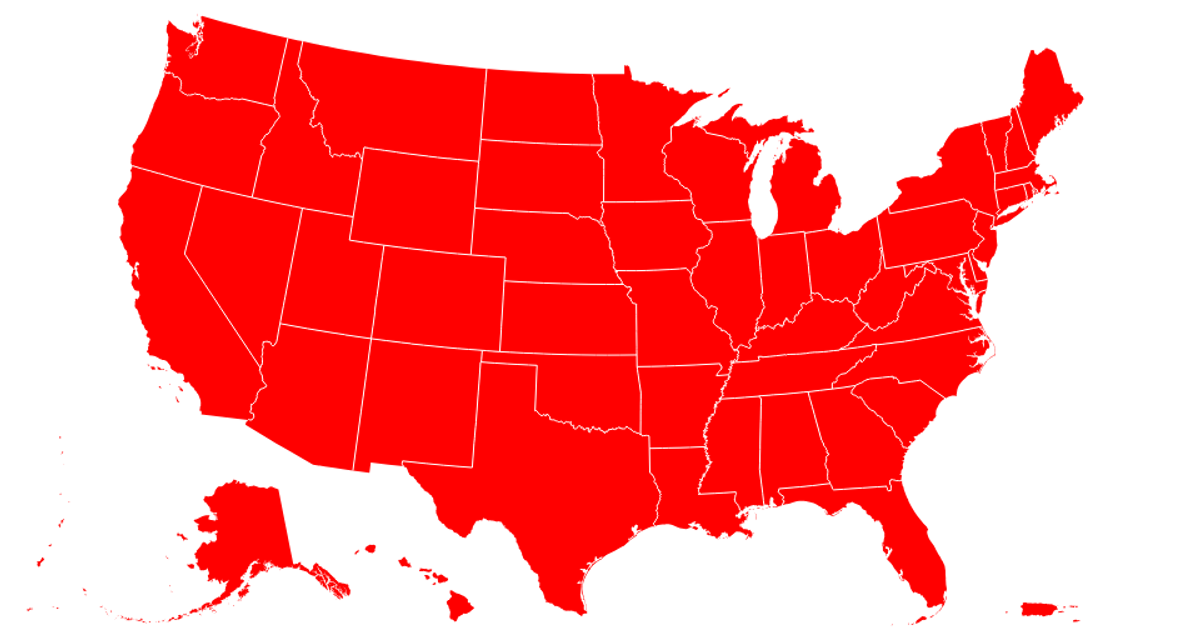
This example presents the initial stage of a state-level map visualization. It displays a U.S. map with light green states, which turn red upon hover, alongside two blue circles marking specific coordinates. The map is built using the D3.js v5 library, employing `d3.geoPath` and `d3.geoAlbersUsa` for the projection and shape rendering. The visualization supports zooming and panning through the `d3.zoom` interaction, and it loads geographic data from a remote JSON source.
AI-generated descriptionThe schedule this week is: Load data onto the Vizhub and plot the state map. This week I set up the map base I am going to use in the future. Also tried the tricks zooming/ spanning and hovering on the map!
MIT Licensed


Comments
Sign in to join the discussion.