🌍 Public
Co-ocurrence matrix
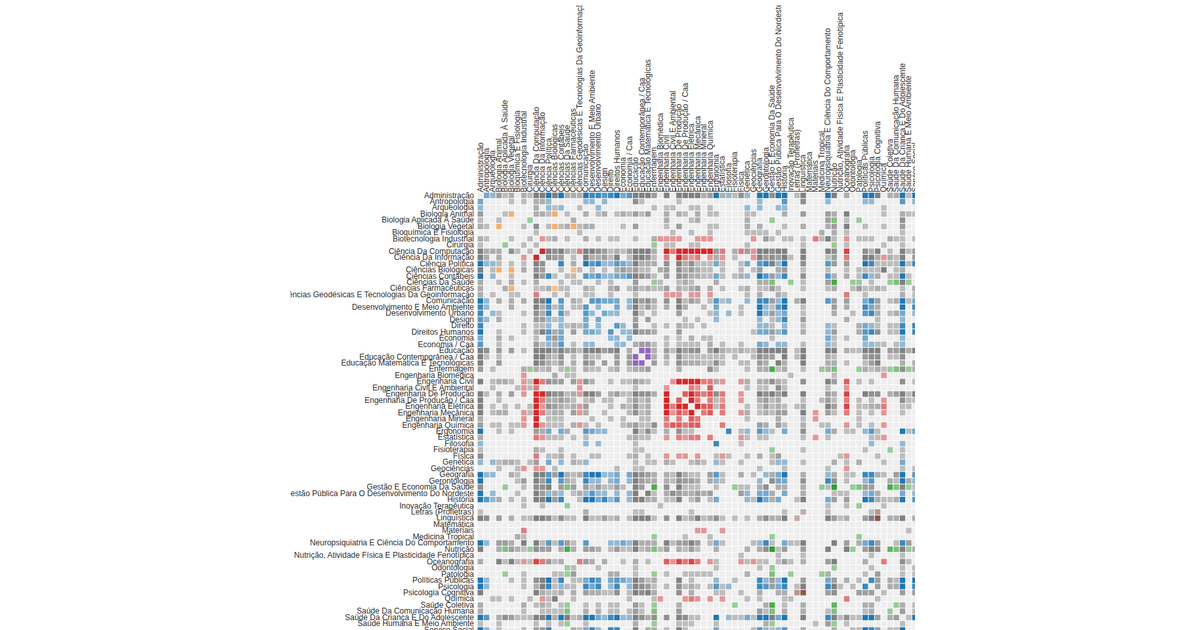
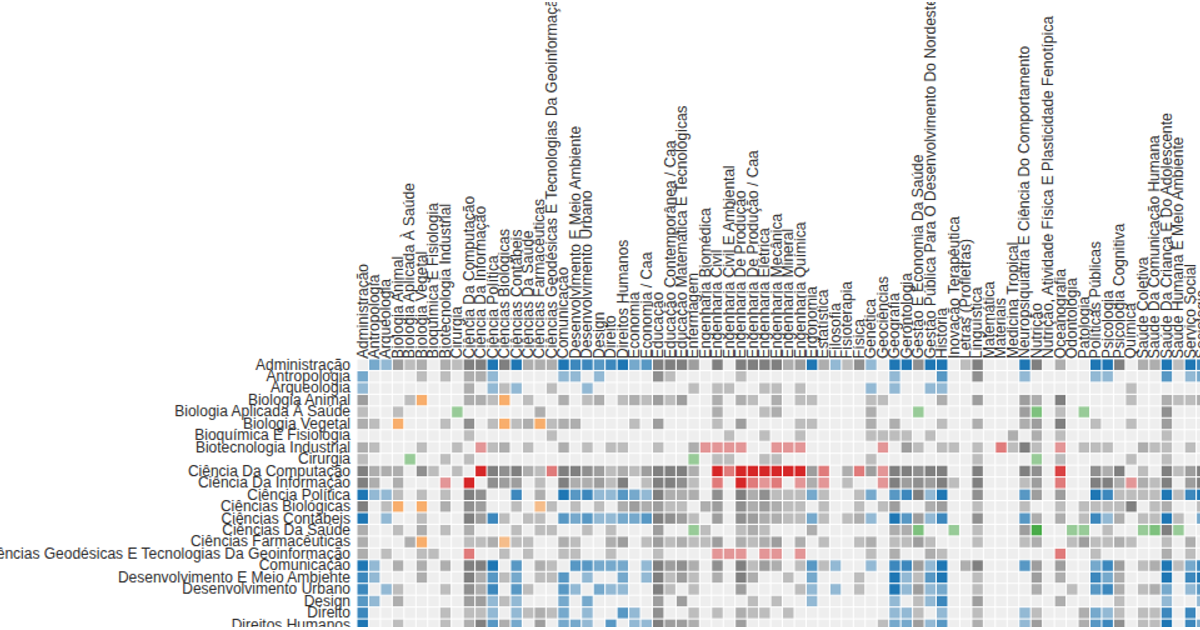
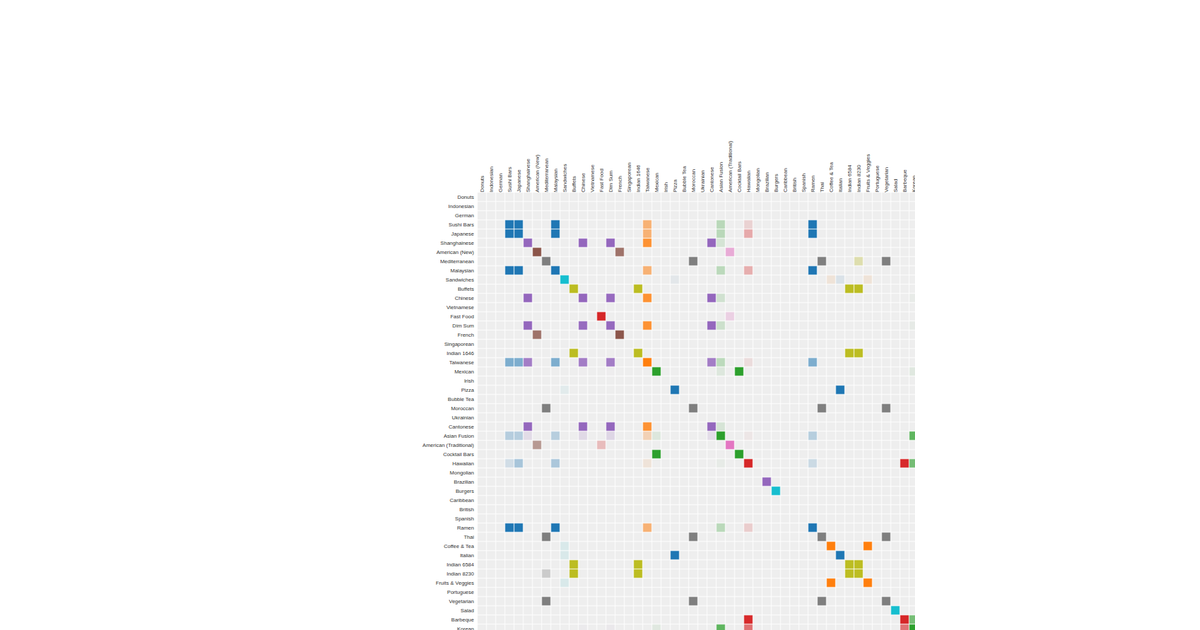
This visualization displays a co-occurrence matrix of academic disciplines, where each cell represents the strength of association between two fields, with color indicating group membership and opacity reflecting link value. Users can reorder the matrix by name, count, or group using a dropdown, triggering animated transitions via `d3.transition()`. The code employs `d3.scaleBand`, `d3.scaleLinear`, `d3.scaleOrdinal`, and `d3.scaleSqrt` for layout and styling, while hover interactions highlight corresponding row and column labels using `d3.selectAll`. Data is loaded from a JSON file with `d3.json`.
AI-generated description<iframe width="560" height="315" src="https://www.youtube.com/embed/jfpV7OBptYE?rel=0" frameborder="0" allow="autoplay; encrypted-media" allowfullscreen></iframe>
[World Countries Hierarchy](https://bl.ocks.org/curran/1dd7ab046a4ed32380b21e81a38447aa)
[Radial Dendrogram](https://observablehq.com/@d3/radial-dendrogram)
MIT Licensed




Comments
Sign in to join the discussion.